 Seven Management and Planning Tools
Seven Management and Planning Tools solution extends ConceptDraw DIAGRAM and ConceptDraw MINDMAP with features, templates, samples and libraries of vector stencils for drawing management mind maps and diagrams.
, t chart, decision matrix, decision tree analysis") Decision Making
Decision Making
The Decision Making solution offers the set of professionally developed examples, powerful drawing tools and a wide range of libraries with specific ready-made vector decision icons, decision pictograms, decision flowchart elements, decision tree icons, decision signs arrows, and callouts, allowing the decision maker (even without drawing and design skills) to easily construct Decision diagrams, Business decision maps, Decision flowcharts, Decision trees, Decision matrix, T Chart, Influence diagrams, which are powerful in questions of decision making, holding decision tree analysis and Analytic Hierarchy Process (AHP), visual decomposition the decision problem into hierarchy of easily comprehensible sub-problems and solving them without any efforts.
 Business and Finance
Use Business and Finance solution to make professional-looking documents, presentations and websites, business, finance, advertising, and project management illustrations, or any designs that requires clipart of currency, office, business, advertising, management, marketing, people, time, post, contacts, collaboration, etc.
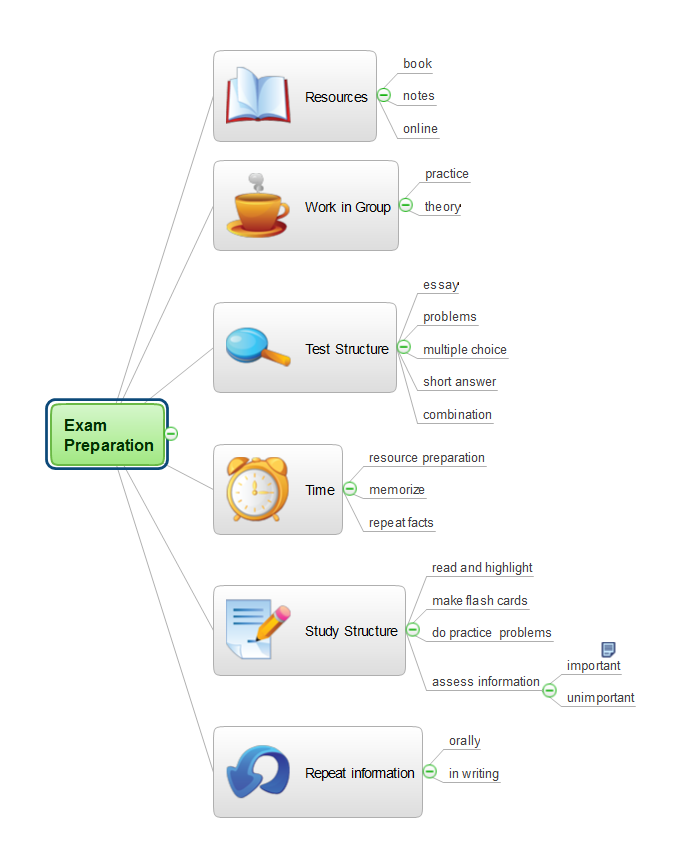
Exam Preparation Mind Map
Venn Diagram Examples for Problem Solving. Environmental Social Science. Human Sustainability Confluence

Fishbone Diagram Design Element
.png)
Business Diagram Software


Flowchart Software


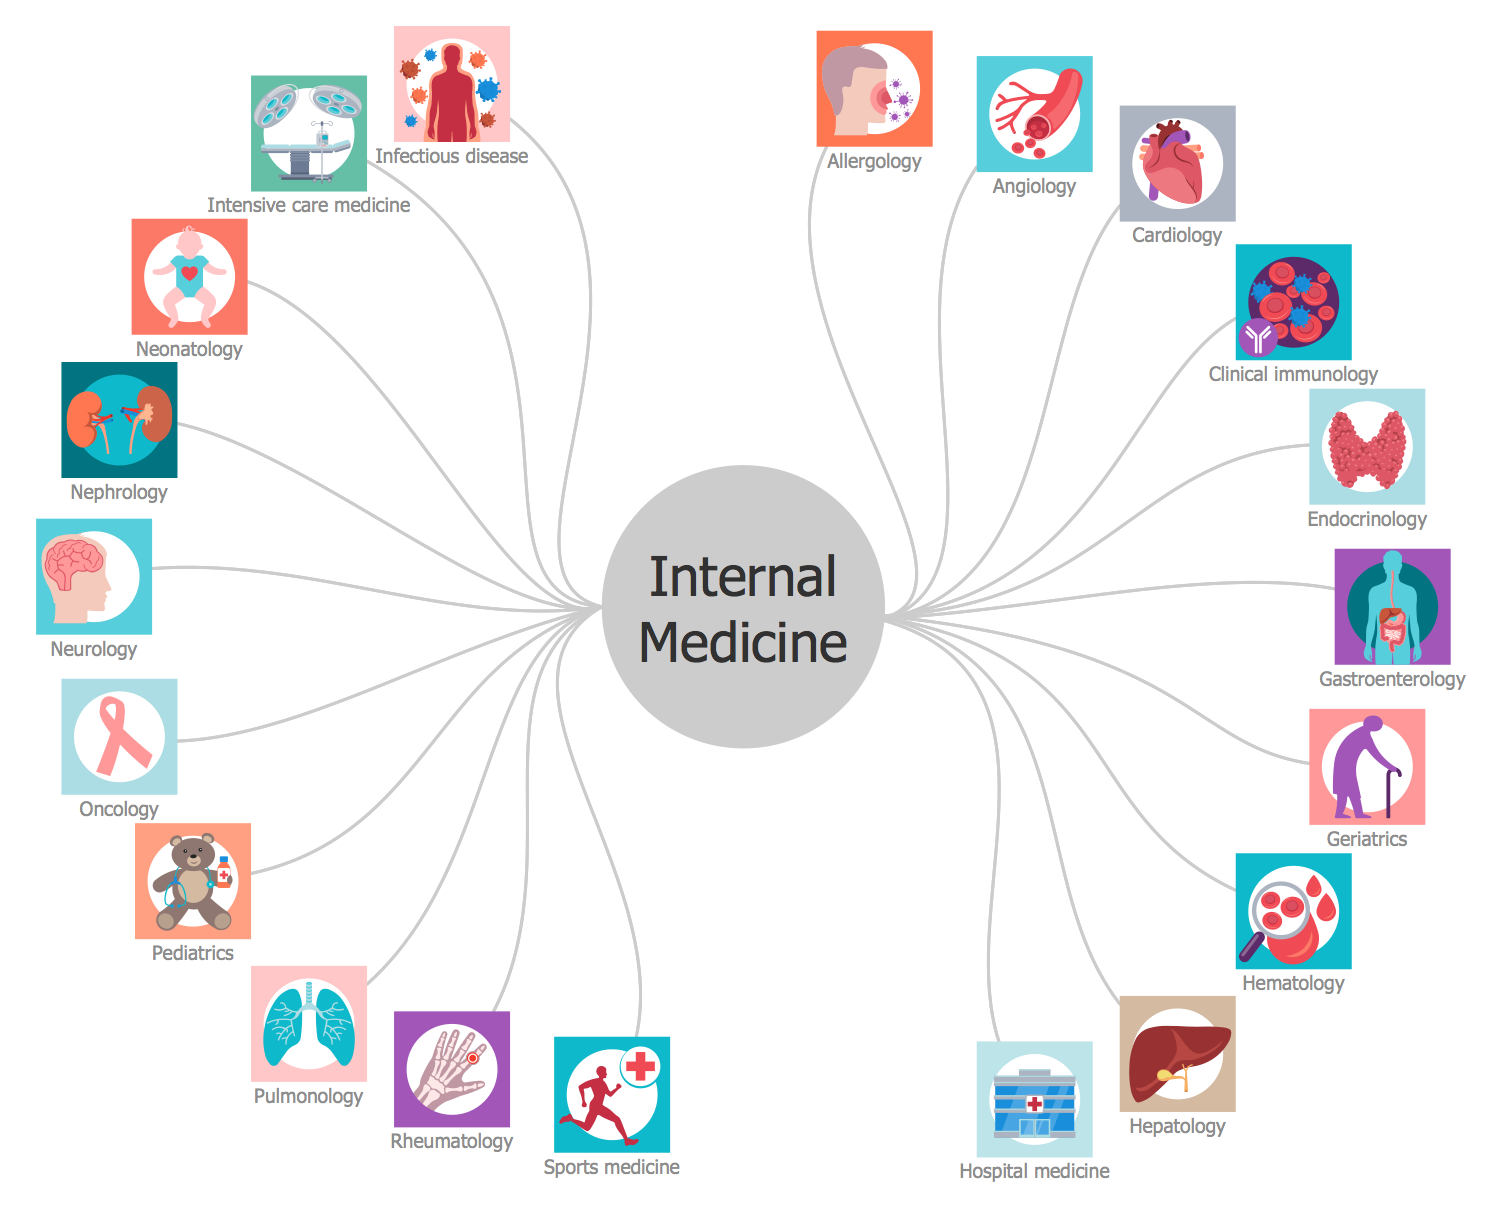
Internal Medicine
Marketing Flow Chart

- Achievement Png
- Objectives Clipart Png
- Png File Of Mile Stone
- Success Png Vectors
- Bed Plan Png
- Fishbone Diagram Problem Solving | Human Resource ...
- Think and act effectively | Percent of students achieved a 36 on ACT ...
- Cause and Effect Diagrams | Cause and Effect Analysis - Fishbone ...
- Fishbone Diagrams | How Do Fishbone Diagrams Solve ...
- Design elements - Scrum artifacts | Sprint Planning Meeting Agenda ...