Flow Chart Symbols
The Flowcharts are incredibly useful and popular tool used in science, business, software development, analytics, engineering, marketing, manufacturing, administration, architecture, government, politics, and many other fields thanks to a variety of existing types of flowcharts. A Flowchart is a visual graphical representation of the process, algorithm, or the set of steps taken for problem's solution. Widely used for designing, visualizing and documenting simple and complex processes and programs, they effectively help to understand the process and to find easier the flaws if they are. Each flowchart type supposes the use of its own set of notations for drawing corresponding diagram, which includes the symbols of process, decision, data, document, data base, termination, initiation processes, processing loops, conditions, etc. It is easily design a Flowchart using the special professional flowchart maker - ConceptDraw DIAGRAM diagram software with numerous predesigned flow chart symbols grouped in libraries of Flowcharts solution from ConceptDraw Solution Park.Local area network (LAN). Computer and Network Examples
Local Area Network (LAN) is a network which consists of computers and peripheral devices connected each other and to the local domain server, and covers a little territory or small number of buildings, such as home, school, laboratory, office, etc. LAN serves for few hundreds of users. It includes many cables and wires, and demands to design previously a Network diagram. All local area network devices can use the shared printers and disk storage. ConceptDraw DIAGRAM is a perfect network diagramming software with examples of LAN Diagrams, templates and predesigned vector objects. ConceptDraw DIAGRAM is the ideal choice for network engineers and network designers who need to draw fast and easy Local Area Network Diagrams, for IT specialists, developers and other IT professionals which need to visualize the communication schemes of LAN and visually document the LAN's physical structure and arrangement in houses, offices and other buildings. Ready-to-use vector objects from Computer Network Diagrams solution will help you design LAN diagrams in minutes.
Cisco Network Design. Cisco icons, shapes, stencils, symbols and design elements
Cisco is the largest company, which specializes in the field of high technologies, develops and sells network equipment mainly for the large organizations and telecommunication companies. Cisco produces wide variety of devices and equipment, such as routers, switches, gateways, servers, network security devices (firewalls, VPN, IDs, etc.), ATM switches, cable modems and DSL equipment, access points Wi-Fi, products for IP telephony, etc. The first commercially successful multi-protocol router, which enabled for previously incompatible computers to communicate between themselves, is also developed by Cisco company. Cisco is a generally accepted standard, which uses globally recognized Cisco icons for all produced Cisco equipment. ConceptDraw DIAGRAM software extended with Cisco Network Diagrams solution from Computer and Network area contains a lot of predesigned Cisco network design elements for professional drawing Cisco network diagrams, visualization computer network topologies, equipment connections and arrangement.Network diagrams with ConceptDraw DIAGRAM
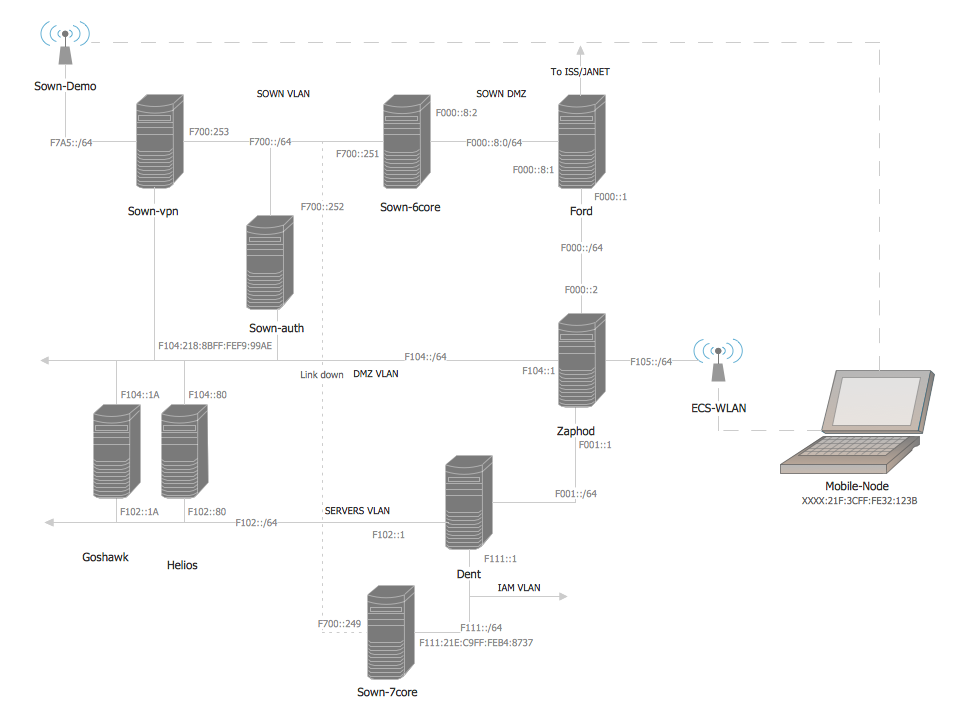
Network diagram is effective tool for representing and description the network knots and connections between them in comprehensible graphic view, for studying and analysis them. The network administrators and engineers actively use Physical Network Diagrams and Logical Network Diagrams, which are both indispensable when developing and documenting new networks, and managing existing ones. Network diagrams let clearly represent the network configuration and structure, used protocols, addresses, and also names of network objects. Physical Network Diagrams depict the information about telecommunications data, servers, location of network equipment and number of network users. Logical Network Diagrams describe about logical network structure. It is useful to use the ready sets of network clipart, pictures and symbols for indication the network knots on a diagram, such as developed by professionals and offered in large quantity by Computer Network Diagrams solution from ConceptDraw Solution Park.ERD Symbols and Meanings
Entity Relationship Diagram (ERD) is a popular software engineering tool for database modeling and illustration the logical structure of databases, which uses one of two notations - Chen's or Crow’s Foot. Crow's foot notation is effective when used in software engineering, information engineering, structured systems analysis and design. Each of these notations applies its own set of ERD symbols. Crow's foot diagrams use boxes to represent entities and lines between these boxes to show relationships. Varied shapes at the ends of lines depict the cardinality of a given relationship. Chen's ERD notation is more detailed way to represent entities and relationships. ConceptDraw DIAGRAM application enhanced with all-inclusive Entity-Relationship Diagram (ERD) solution allows design professional ER diagrams with Chen's or Crow’s Foot notation on your choice. It contains the full set of ready-to-use standardized ERD symbols and meanings helpful for quickly drawing, collection of predesigned ERD samples, examples and templates. ConceptDraw Pro is a great alternative to Visio for Mac users as it offers more features and can easily handle the most demanding professional needs.
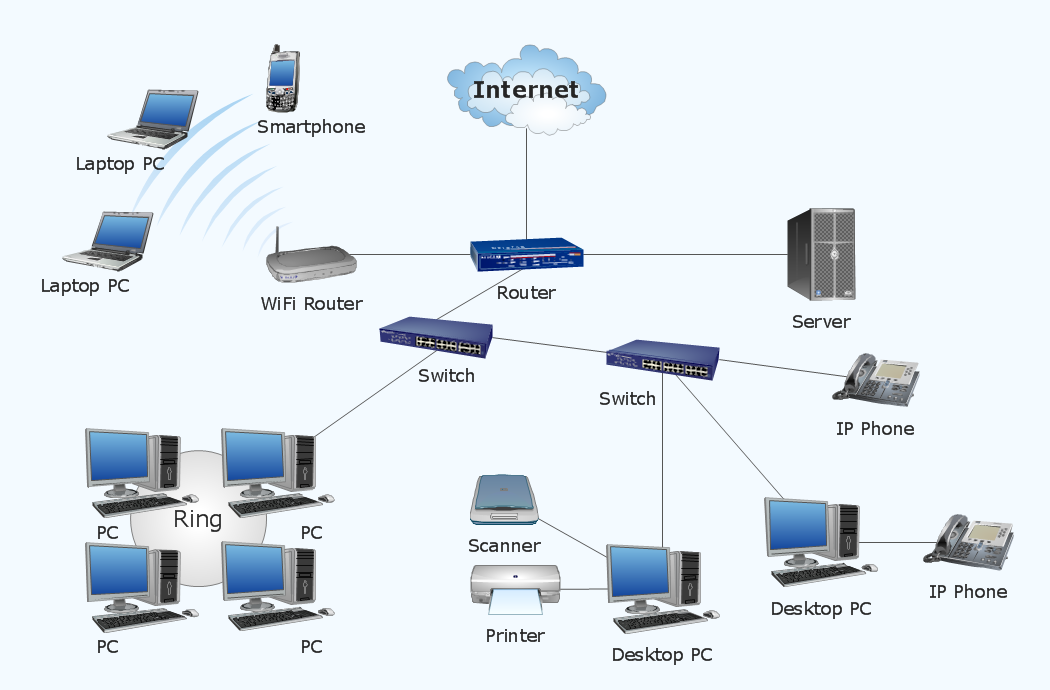
Diagram of a Basic Computer Network. Computer Network Diagram Example
This sample was created in ConceptDraw DIAGRAM diagramming and vector drawing software using the Computer and Networks solution from Computer and Networks area of ConceptDraw Solution Park. This sample shows the connection scheme of the home WLAN equipment to the Internet.ConceptDraw Arrows10 Technology
How should diagramming software work? Is it possible to develop a diagram as quickly as the ideas come to you? The innovative ConceptDraw Smart Connectors Technology - This is more than enough versatility to draw any type of diagram with any degree of complexity. Connection points are necessary for diagramming network, flowchart and organizational charts. In ConceptDraw you connect shapes by attaching, or snapping and gluing, connectors to shape connection points.Wide area network (WAN) topology. Computer and Network Examples
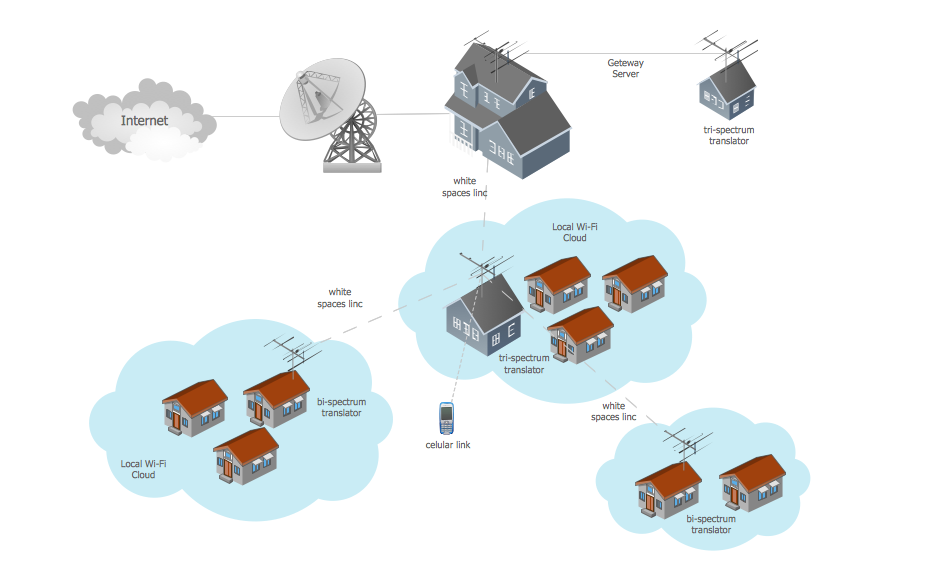
Wide area network (WAN) is a type of telecommunication network, which is used to connect the computers on a wide geographical area. WANs are quite popular and widely used networks, the most known and bright example of WAN is the Internet. They offer exceedingly convenient and quick way of exchanging information and data between employees, suppliers, and clients that are geographically remote each other. WANs are often constructed from several smaller networks (LANs, MANs, etc.) and use effectively different packet switching and circuit switching technologies. ConceptDraw DIAGRAM is a powerful network diagramming software. Including Computer and Networks Area with extensive variety of solutions, ConceptDraw DIAGRAM offers a lot of ready-to-use predesigned vector stencils, wide set of examples and samples, helping the business and government entities effectively design professional-looking Wide area networks (WANs) and Wide area network topology diagrams of any complexity. Wide export capabilities of ConceptDraw DIAGRAM greatly extend your opportunities.
Data Flow Diagram Symbols. DFD Library
Data Flow Diagrams graphically represent the information transfers and process steps of a system. They visually depict how data are processed by a system in terms of inputs and outputs, how occurs the input in a system, how the data flow through an information system and where they are stored, and how occurs output from the system. DFDs give the overview of the system and models the processes aspects, they are maintained with other methods of structured systems analysis. The main goal of DFDs is achievement of understanding between developers and users. For their construction are used two notations - Gane-Sarson and Yourdon, each of them uses its own set of symbols. Data Flow Diagrams solution from Software Development area extends the ConceptDraw DIAGRAM software with templates, samples, and predesigned libraries of data flow diagram symbols for both notations, allowing you easy design the process-oriented and data-oriented models, draw the Data Flow Diagrams, Data Flowcharts, Data Process Diagrams, Information Flow Diagrams, Structured Analysis Diagrams, etc.Entity Relationship Diagram Symbols
The semantic modeling method nowadays is successfully applied in database structure design. It is effective method of modeling the data structures, which is based on the meaning of these data. As a tool of semantic modeling, there are used different types of Entity-Relationship Diagrams. Entity Relationship Diagram (ERD) is applied to visually and clearly represent a structure of a business database. The main components of ERDs are: entity, relation and attributes. An entity is a class of similar objects in the model, each entity is depicted in the form of rectangle and has the name expressed by a noun. Relation is shown in the form of non-directional line that connects two entities. There are several notation styles used for ERDs: information engineering style, Chen style, Bachman style, Martin Style. The Entity Relationship Diagram symbols used for professional ERD drawing are predesigned by professionals and collected in the libraries of the Entity-Relationship Diagram (ERD) solution for ConceptDraw DIAGRAM software.- Cisco Routers. Cisco icons , shapes, stencils and symbols | Design ...
- Networking Symbol
- Network Outlet Symbol
- Basic Network Diagram | Network Security Diagrams | Network ...
- Wide area network (WAN) topology. Computer and Network ...
- Network Hubs | Star Network Topology | Cisco Switches and Hubs ...
- Design elements - Network layout floorplan | Design elements ...
- Wide area network (WAN) topology. Computer and Network Examples
- Cisco LAN. Cisco icons , shapes, stencils and symbols | Star Network ...


