Column Chart Template

Bar Chart Template for Word

Bar Chart Template

Chart Maker for Presentations

Chart Templates

Column Chart Examples

Column Chart Software

Use this vertical bar chart template to design your column charts in the ConceptDraw PRO diagramming and vector drawing software.
"Bar graphs can ... be used for more complex comparisons of data with grouped bar charts and stacked bar charts. In a grouped bar chart, for each categorical group there are two or more bars. These bars are color-coded to represent a particular grouping. For example, a business owner with two stores might make a grouped bar chart with different colored bars to represent each store: the horizontal axis would show the months of the year and the vertical axis would show the revenue. Alternatively, a stacked bar chart could be used. The stacked bar chart stacks bars that represent different groups on top of each other. The height of the resulting bar shows the combined result of the groups. However, stacked bar charts are not suited to datasets where some groups have negative values. In such cases, grouped bar charts are preferable." [Bar chart. Wikipedia]
The column chart template "Double bar graph" is included in the Basic Bar Graphs solution from the Graphs and Charts area of ConceptDraw Solution Park.
Template

Sales Growth. Bar Graphs Example

Bar Chart Examples

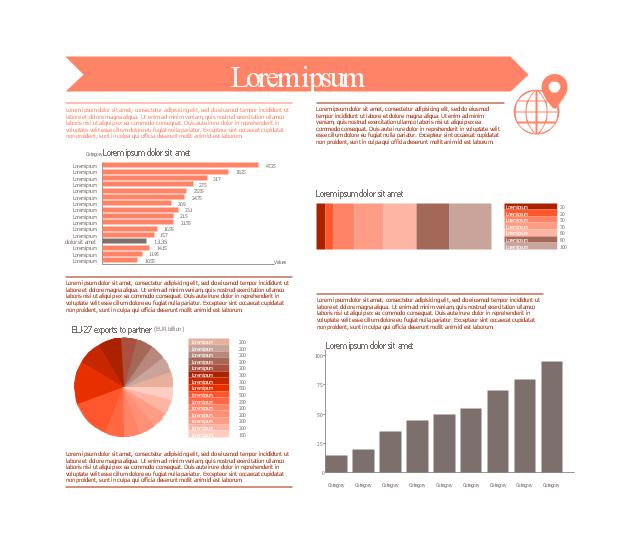
This marketing infographic template consists of design elements: title block, callout blocks, pictogram, horizontal bar graph, column chart, divided bar diagram, pie chart.
Use it to create your marketing infograms in the ConceptDraw PRO diagramming and vector drawing software.
The template "Marketing infogram 3" is included in the Marketing Infographics solution from the Business Infographics area of ConceptDraw Solution Park.
Use it to create your marketing infograms in the ConceptDraw PRO diagramming and vector drawing software.
The template "Marketing infogram 3" is included in the Marketing Infographics solution from the Business Infographics area of ConceptDraw Solution Park.
Marketing infogram template
Feature Comparison Chart Software

The vector stencils library "Bar charts" contains 7 templates of bar and column charts for visualizing quantitative and statistical data comparison and changes in time series. Drag template from library to your document and enter your data.
Use these shapes to draw your bar graphs in the ConceptDraw PRO diagramming and vector drawing software.
The vector stencils library "Bar charts" is included in the Bar Graphs solution from the Graphs and Charts area of ConceptDraw Solution Park.
Use these shapes to draw your bar graphs in the ConceptDraw PRO diagramming and vector drawing software.
The vector stencils library "Bar charts" is included in the Bar Graphs solution from the Graphs and Charts area of ConceptDraw Solution Park.
Vertical bar chart

Horizontal bar chart

3D bar chart

Cylindrical bar chart

Double bar chart

Column chart - serial

Horizontal bar chart - serial

Coordinate system 3D

Pie Chart Word Template. Pie Chart Examples

Bar Chart Software

- Bar Chart Template for Word | Column Chart Template | Bar Chart ...
- Bar Chart Template for Word | Column Chart Template | Bar Chart ...
- Column Chart Examples | Sales Growth. Bar Graphs Example ...
- Double bar graph - Template | Column Chart Template | Bar chart ...
- Bar Chart Template for Word | Financial Comparison Chart | Column ...
- Bar Chart Template for Word | Waterfall Bar Chart | Column Chart ...
- Bar Chart Template for Word | Bar Chart Template | Column Chart ...
- Chart Maker for Presentations | Column Chart Template | Chart ...
- Bar Chart Examples | Bar Chart Template | Column Chart Software ...
- Bar Graphs | Column Chart Template | Financial Comparison Chart ...
- Bar chart - Template | Bar Chart Template for Word | Column Chart ...
- Bar Graphs | Column Chart Examples | Column Chart Template | Bar ...
- Bar Graphs | Column Chart Template | Barchart Of Computer Crime
- Bar Chart | Column Chart Template | Bar Chart Examples | Show ...
- Bar Graphs | Column Chart Template | Bar Diagrams for Problem ...
- Bar Chart Template for Word | Bar Chart Examples | Rainfall Bar ...
- Bar Chart Template for Word | Donut Chart Templates | Column ...
- Double bar graph - Template | Double bar chart - Nitrate ...
- Double bar graph - Template | Bar Chart Examples | Column Chart ...