Winter Sports Vector Clipart. Medal Map. Spatial Infographics

Pyramid Diagram

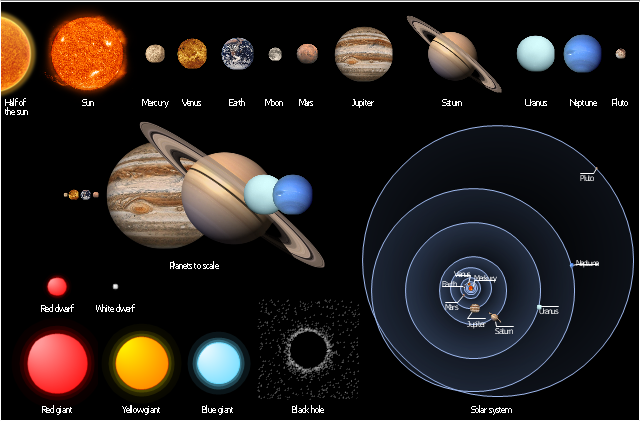
The vector stencils library "Stars and planets" contains 20 clipart images of sun, solar system planets and moon.
"A star is a massive, luminous sphere of plasma held together by its own gravity. The nearest star to Earth is the Sun, which is the source of most of the planet's energy. Some other stars are visible from Earth during the night, appearing as a multitude of fixed luminous points due to their immense distance. Historically, the most prominent stars were grouped into constellations and asterisms, and the brightest stars gained proper names. Extensive catalogues of stars have been assembled by astronomers, which provide standardized star designations." [Star. Wikipedia]
"A planet is an astronomical object orbiting a star or stellar remnant that is massive enough to be rounded by its own gravity, is not massive enough to cause thermonuclear fusion, and has cleared its neighbouring region of planetesimals. ... As scientific knowledge advanced, human perception of the planets changed, incorporating a number of disparate objects. In 2006, the International Astronomical Union (IAU) officially adopted a resolution defining planets within the Solar System. This definition has been both praised and criticized and remains disputed by some scientists because it excludes many objects of planetary mass based on where or what they orbit. Although eight of the planetary bodies discovered before 1950 remain "planets" under the modern definition, some celestial bodies, such as Ceres, Pallas, Juno, Vesta (each an object in the Solar asteroid belt), and Pluto (the first-discovered trans-Neptunian object), that were once considered planets by the scientific community are no longer viewed as such." [Planet. Wikipedia]
The clipart example "Design elements - Stars and planets" was created using the ConceptDraw PRO diagramming and vector drawing software extended with the Astronomy solution from the Science and Education area of ConceptDraw Solution Park.
Stars and planets clipart
How to Make an Infographic

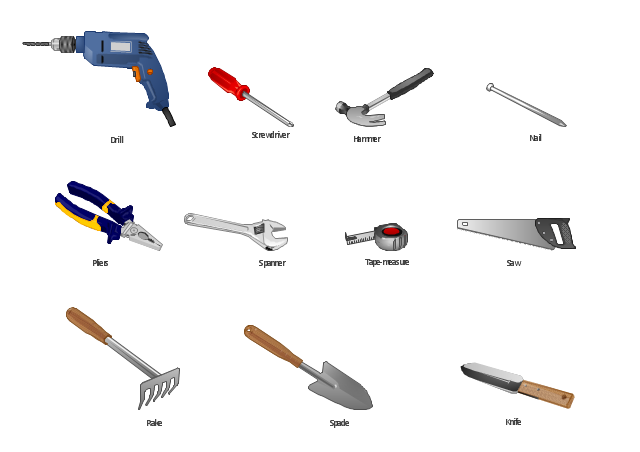
The vector stencils library "Tools" for the ConceptDraw PRO diagramming and vector drawing software contains 11 clipart images of hand-held tools.
"A tool is any physical item that can be used to achieve a goal, especially if the item is not consumed in the process. Informally the word is also used to describe a procedure or process with a specific purpose.
Tools that are used in particular fields or activities may have different designations such as "instrument", "utensil", "implement", "machine", or "apparatus". The set of tools needed to achieve a goal is "equipment". The knowledge of constructing, obtaining and using tools is technology." [Tool. Wikipedia]
The vector clip art library "Tools" is included in the Manufacturing and Maintenance solution from the Illustration area of ConceptDraw Solution Park.
Vector clip art
Architecture Diagrams

How can you illustrate the weather condition

Basketball Field in the Vector

The vector stencils library "Management pictograms" contains 72 management pictograms.
Use it to create your management infogram in the ConceptDraw PRO diagramming and vector drawing software.
The flat icons example "Management pictograms - Vector stencils library" is included in the solution "Marketing infographics" from the "Business infographics" area of ConceptDraw Solution Park.
Use it to create your management infogram in the ConceptDraw PRO diagramming and vector drawing software.
The flat icons example "Management pictograms - Vector stencils library" is included in the solution "Marketing infographics" from the "Business infographics" area of ConceptDraw Solution Park.
Accounting management

Activity

Audit management

Board of directors

Budget

Business managemen

Business management tools

Business model

Commanding

Communication

Company

Contract management

Controlling

Coordinating

Core competencies

Corporate strategy

Creativity

Crisis management

Crisis management 2

Decision making

Environmental management

Expenses

External environment

Financial management

Financial management 2

Financial planning

First-level manager

Goal

HR management

Investment management

IT management

Knowledge management

Knowledge management 2

Leadership

Macro environment

Management system

Managerial accounting

Manufacturing management

Market orientation

Marketing management

Marketing strategy

Middle-level manager

Mission

Objectives

Operations management

Organizing

Performance

Performance management

Planning

Policy

PR management

Problem solving

Process management

Product management

Profit

Profit 2

Project management

Quality management

Research and development

Resource management

Resources

Risk management

Sales manegment

Service management

Stakeholder management

Strategic management

Strategic planning

Technology management

Time frame

Time management

Top-level manager

Vision

Education Information

HelpDesk
How to Draw a Mind Map on PC Using ConceptDraw MINDMAP


Winter Sports. Illustrations and Visualize Statistics

Biology Drawing

- Knowledge Management Free Clip Art Png
- Knowledge Clipart Png
- Techno Png Logo
- Screwdriver Png Red
- Knowledge Management Clip Art
- Nail Png Vector
- Dollar Sign In Circular Frame Png Vector
- Nail Vector Png
- Strategic Planning Icon Png
- Research Vector Png
- Knowledge Sharing Png
- Financial Management Clipart Png
- Png Vector Icon For Knowledge
- Procedure Clipart Png
- Drawing a Nature Scene | Beauty in nature Illustrations and Clipart ...
- Time Management Clipart Png
- Grass Png Clipart
- Knowledge Icon Vector Png
- Curved Arrow Clipart Png Transparent
- Pie Charts | Food Art | Cooking Recipes | Table Of Fruits Clipart Png