Basic Flowchart Symbols and Meaning


Entity Relationship Diagram Symbols

Types of Flowcharts


TQM Diagram — Professional Total Quality Management

Electrical Symbols, Electrical Diagram Symbols

Sales Process Flowchart. Flowchart Examples

Process Flow Chart Symbols

Mechanical Drawing Symbols

The vector stencils library "iPhone interface" contains 119 iPhone UI design elements.
Use it for development of graphic user interface (GUI) for iPhone software applications in the ConceptDraw PRO diagramming and vector drawing software extended with the Graphic User Interface solution from the Software Development area of ConceptDraw Solution Park.
Use it for development of graphic user interface (GUI) for iPhone software applications in the ConceptDraw PRO diagramming and vector drawing software extended with the Graphic User Interface solution from the Software Development area of ConceptDraw Solution Park.
iPhone case

iPhone case, horizontal

Display
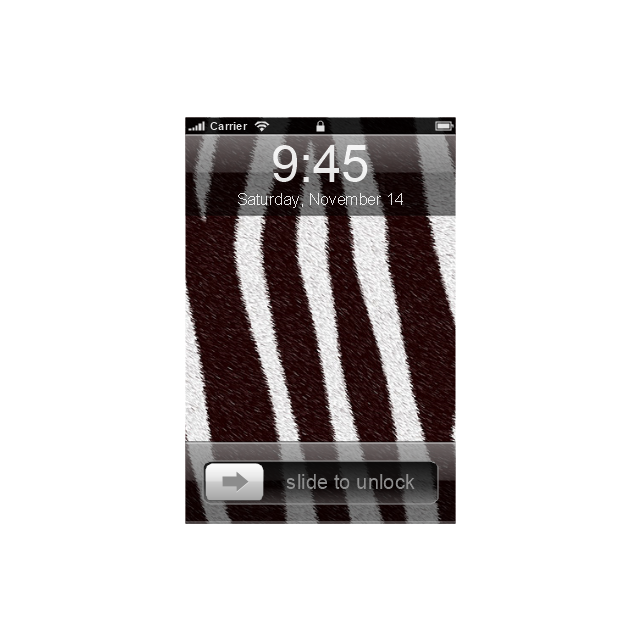
Screen

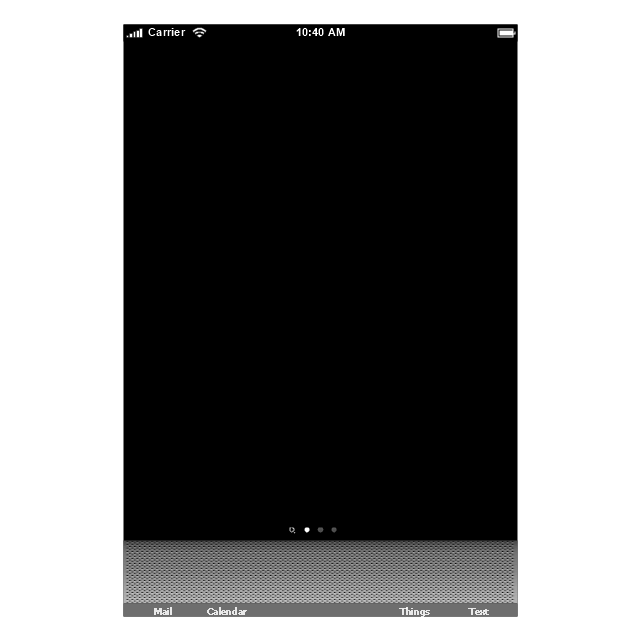
Home screen
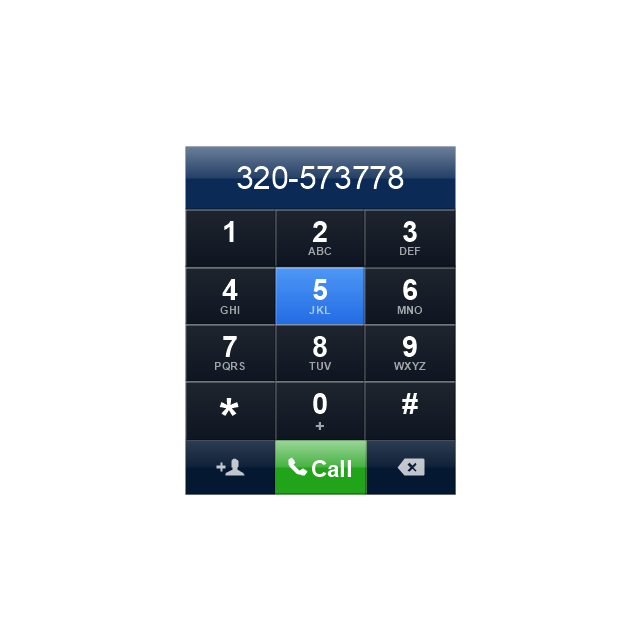
Keypad control
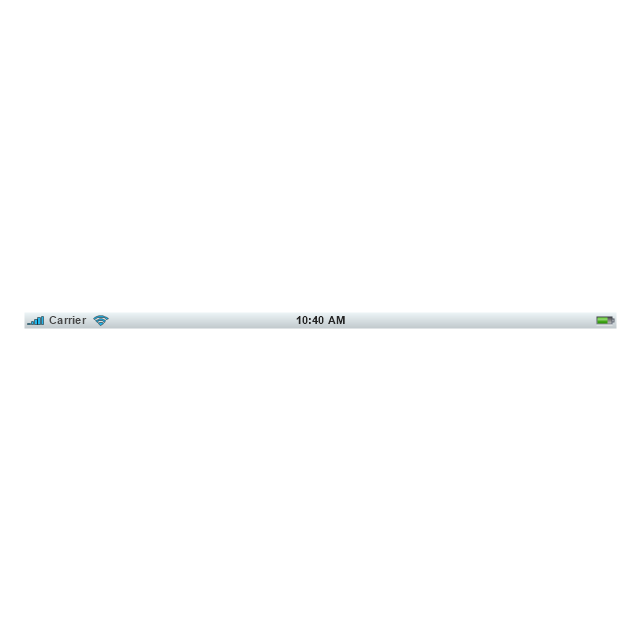
Status bar
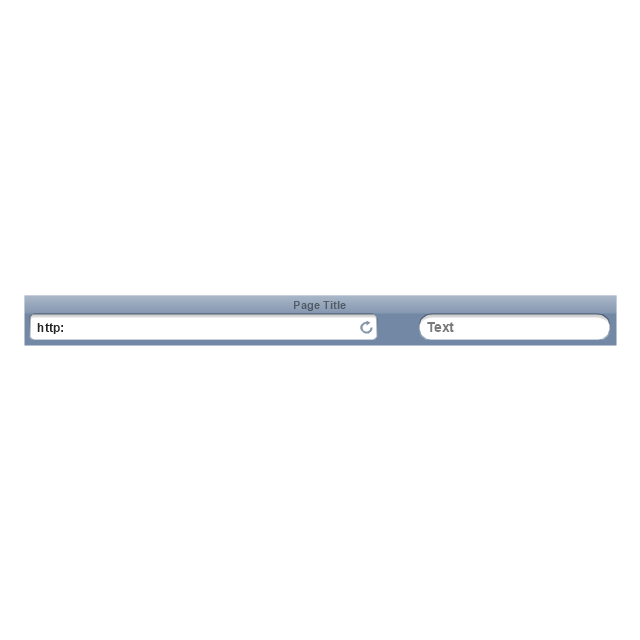
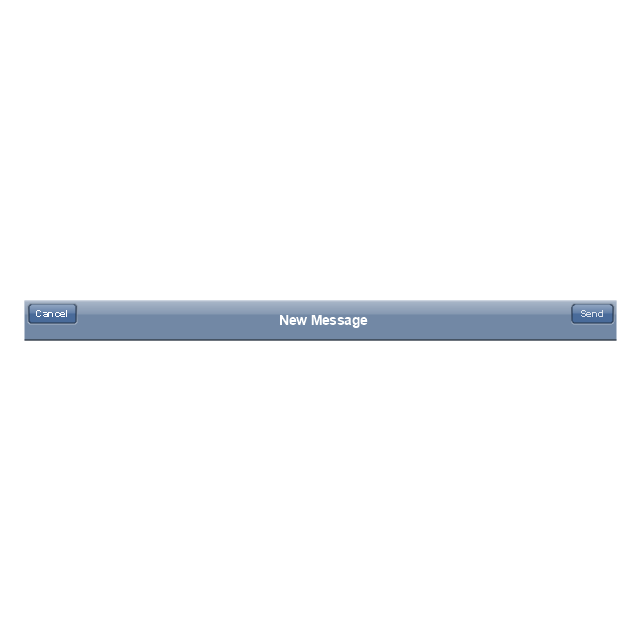
Navigation bar

Navigation bar with buttons

Navigation bar with controls
Navigation bar with controls
Navigation bar with buttons, horizontal
Navigation bar with controls, horizontal
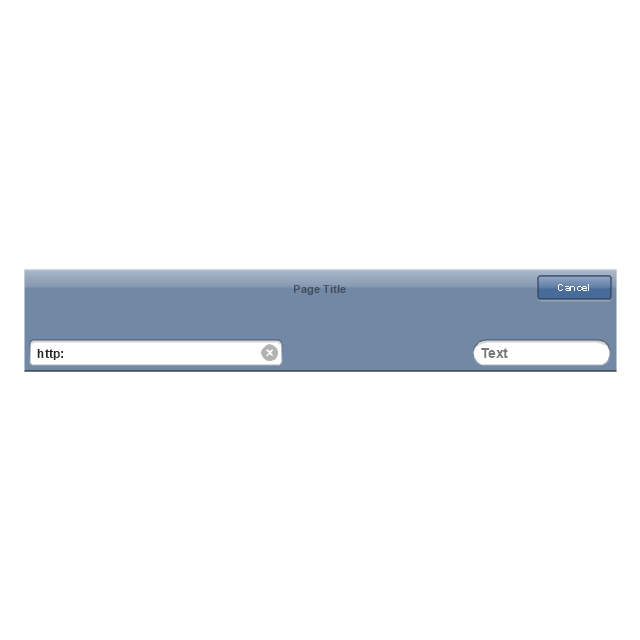
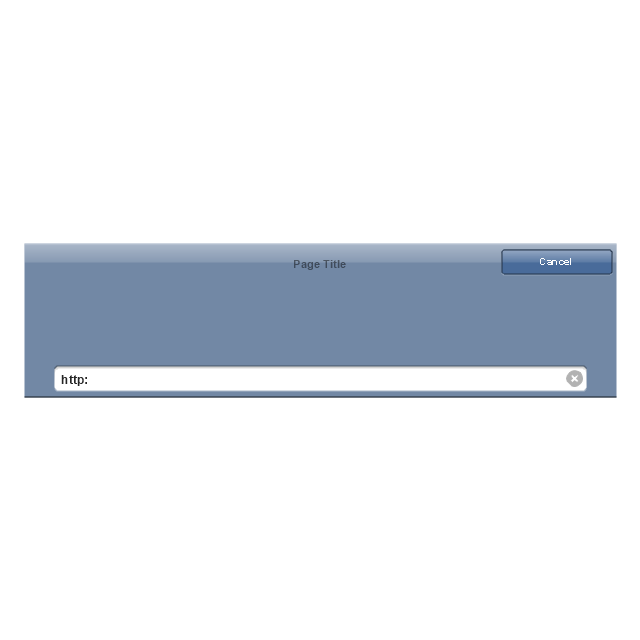
Modal view
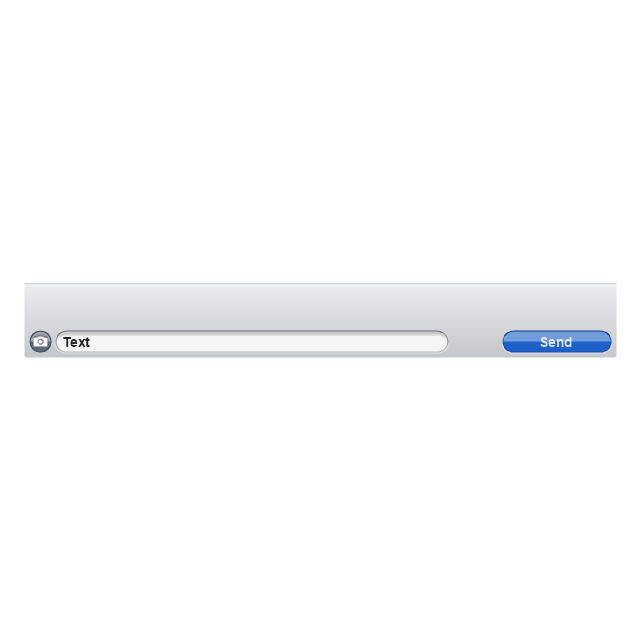
Search bar

Text field 1

Text field 2

Text field, varying

Table row

Table view row
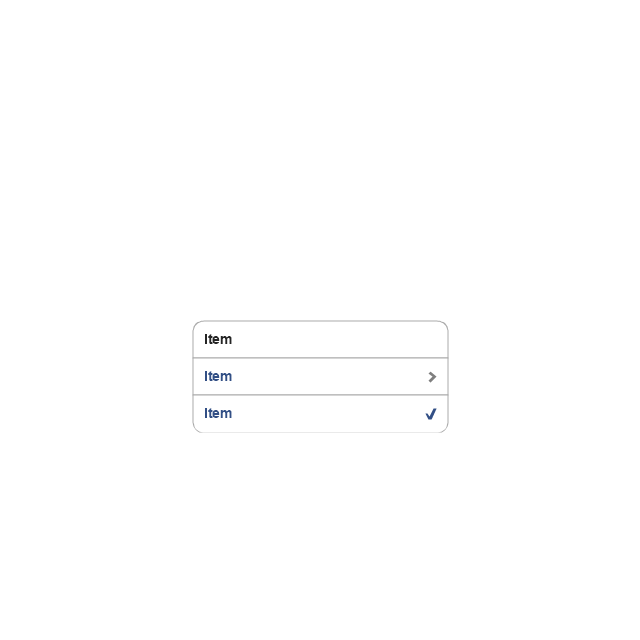
Table view (simple list)
-iphone-interface---vector-stencils-library.png--diagram-flowchart-example.png)
Table view (with header)
-iphone-interface---vector-stencils-library.png--diagram-flowchart-example.png)
Action list
Control button

Navigational control button

Add button

Navigation toolbar

Tab bar

Action sheet

Choice button

Rounded rectangle button

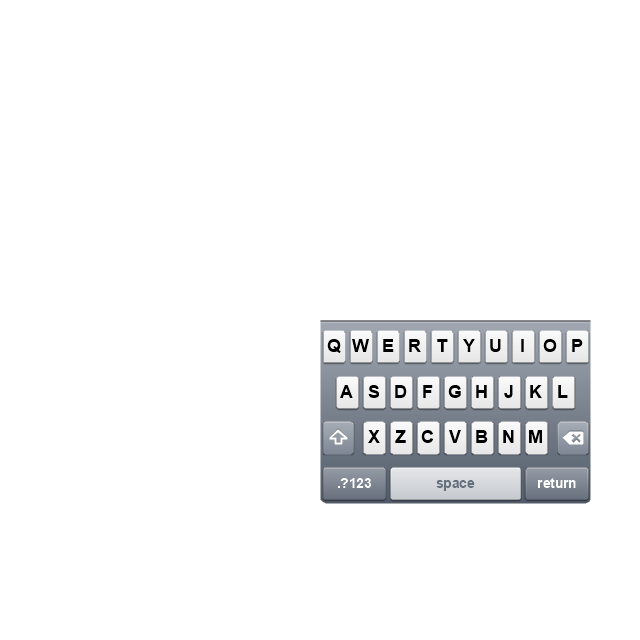
Keyboard control
Keyboard literal button

Keyboard button, pressed
Keyboard label button

Selection frame 1

Selection frame 2

Loupe

Message box 1
Message box 2
Progress view

Progress view

Progress view

Player control
Label button

Back button

Forward button

Option button
Checkbox

Radio button

Alert
Two-button alert
Two-button alert (v 3.0)
-iphone-interface---vector-stencils-library.png--diagram-flowchart-example.png)
Up-Down control

Segmented control

Segmented control

Segmented control
Segmented control
Pop-up menu button

Popup menu

Clock, white

Clock, black

Clock application table

Date and time picker (1/2 parts)
-iphone-interface---vector-stencils-library.png--diagram-flowchart-example.png)
Date and time picker (3 parts)
-iphone-interface---vector-stencils-library.png--diagram-flowchart-example.png)
Date and time picker (4 parts)
-iphone-interface---vector-stencils-library.png--diagram-flowchart-example.png)
Date and time picker (v 3.0)
-iphone-interface---vector-stencils-library.png--diagram-flowchart-example.png)
Switch control

System button

Reply button

Organize button

Remove button

Refresh button

Play button

FastForward button

Pause button

Rewind button

Backward icon
Forward icon
Share button

Camera button

Compose button

Bookmarks button

Search button

Add button

Trash button

Bookmarks tab icon
Contacts tab icon
Downloads tab icon
Favorites tab icon
Featured tab icon
History tab icon
MostRecent tab icon
MostViewed tab icon
Search tab icon
More tab icon
SMS tab icon
Mail tab icon
Charts tab icon
World clock tab icon
Alarm tab icon
Stopwatch tab icon
Timer tab icon
Badge
Delete button control

Checkmark

Delete button

Insert

Disclosure indicator

Clear button

Bookmarks badge
Badge with varying width 1
Badge with varying width 2
Badge with varying width 3
Activity indicator

Network activity indicator

Page control

Search badge
Slider

Affinity Diagram

- Clearly Labelled Diagram To Illustrate All Indicators
- Labelled Diagram Of A Stop Watch
- Network Drawing Software | Labelled Diagram Of Electric Circuit
- Diagram Business Indicators
- Data structure diagram with ConceptDraw PRO | How To Make a ...
- 4 Level pyramid model diagram - Information systems types ...
- Pyramid Diagram | Process Flowchart | Pyramid Diagram | Chart Of ...
- 4 Level pyramid model diagram - Information systems types
- How to Connect Text Data to a Time Series Chart on Your Live ...