 Telecommunication Network Diagrams
Telecommunication Network Diagrams solution extends ConceptDraw PRO software with samples, templates, and great collection of vector stencils to help the specialists in a field of networks and telecommunications, as well as other users to create Computer systems networking and Telecommunication network diagrams for various fields, to organize the work of call centers, to design the GPRS networks and GPS navigational systems, mobile, satellite and hybrid communication networks, to construct the mobile TV networks and wireless broadband networks.
ERD Symbols and Meanings


The vector stencils library "Sales flowchart" contains 62 sales process flow chart symbols.
Use these flow chart icon set to draw your sales flowcharts, workflow diagrams and process charts with the ConceptDraw PRO diagramming and vector drawing software.
The sales process flowchart symbols library "Sales flowchart" is included in the Sales Flowcharts solution from the Marketing area of ConceptDraw Solution Park.
Annotation

Card

Check / audit (diamond)
-sales-flowchart---vector-stencils-library.png--diagram-flowchart-example.png)
Check / audit (square)
-sales-flowchart---vector-stencils-library.png--diagram-flowchart-example.png)
Collate

Comment / note symbol (brace)
-sales-flowchart---vector-stencils-library.png--diagram-flowchart-example.png)
Communication link

Compare (diamond)
-sales-flowchart---vector-stencils-library.png--diagram-flowchart-example.png)
Compare (square)
-sales-flowchart---vector-stencils-library.png--diagram-flowchart-example.png)
Completed form

Concurrency symbol (fork / join)
-sales-flowchart---vector-stencils-library.png--diagram-flowchart-example.png)
Conditional selector

Control transfer

Database

Data input / output

Decision

Decision indicator - No

Decision indicator - Yes

Delay

Direct access storage

Disk storage

Display

Divided process (table view)
-sales-flowchart---vector-stencils-library.png--diagram-flowchart-example.png)
Document

Entity (rounded)
-sales-flowchart---vector-stencils-library.png--diagram-flowchart-example.png)
Event

Extract

Flow line

Internal storage

Junction symbol

Lined document

Lined / shaded process

Loop limit

Manual file

Manual input

Manual operation

Merge

Multi document

Multi process

Off-page reference - arrow
Off-page reference - incoming

Off-page reference - outgoing

On-page reference/ Inspection point

Or

Page

Paper tape

Predefined process

Prepare conditional

Process step

Reference point

Sequential access storage

Sort

Start (circle)
-sales-flowchart---vector-stencils-library.png--diagram-flowchart-example.png)
Start (ellipse)
-sales-flowchart---vector-stencils-library.png--diagram-flowchart-example.png)
Stickman pictogram

Stored data

Summary

Tagged document

Tagged process

Terminal point

Title block

Torso pictogram

The vector stencils library "HR flowchart" contains 62 flowchart symbols.
Use it to draw your HR flowcharts, workflow diagrams and process charts with the ConceptDraw PRO diagramming and vector drawing software.
The flow chart symbols library "HR flowchart" is included in the HR Flowcharts solution from the Management area of ConceptDraw Solution Park.
Use it to draw your HR flowcharts, workflow diagrams and process charts with the ConceptDraw PRO diagramming and vector drawing software.
The flow chart symbols library "HR flowchart" is included in the HR Flowcharts solution from the Management area of ConceptDraw Solution Park.
Annotation

Card

Check / audit (diamond)
-hr-flowchart---vector-stencils-library.png--diagram-flowchart-example.png)
Check / audit (square)
-hr-flowchart---vector-stencils-library.png--diagram-flowchart-example.png)
Collate

Comment / note symbol (brace)
-hr-flowchart---vector-stencils-library.png--diagram-flowchart-example.png)
Communication link

Compare (diamond)
-hr-flowchart---vector-stencils-library.png--diagram-flowchart-example.png)
Compare (square)
-hr-flowchart---vector-stencils-library.png--diagram-flowchart-example.png)
Completed form

Concurrency symbol (fork / join)
-hr-flowchart---vector-stencils-library.png--diagram-flowchart-example.png)
Conditional selector

Control transfer

Data input / output

Database

Decision

Decision indicator - No

Decision indicator - Yes

Delay

Direct access storage

Disk storage

Display

Divided process (table view)
-hr-flowchart---vector-stencils-library.png--diagram-flowchart-example.png)
Document

Entity (rounded)
-hr-flowchart---vector-stencils-library.png--diagram-flowchart-example.png)
Event

Extract

Flow line

Internal storage

Junction symbol

Lined document

Lined / shaded process

Loop limit

Manual file

Manual input

Manual operation

Merge

Multi document

Multi process

Off-page reference - arrow
Off-page reference - incoming

Off-page reference - outgoing

On-page reference/ Inspection point

Or

Page

Paper tape

Predefined process

Prepare conditional

Process step

Reference point

Sequential access storage

Sort

Start (circle)
-hr-flowchart---vector-stencils-library.png--diagram-flowchart-example.png)
Start (ellipse)
-hr-flowchart---vector-stencils-library.png--diagram-flowchart-example.png)
Stickman pictogram

Stored data

Summary

Tagged document

Tagged process

Terminal point

Title block

Torso pictogram

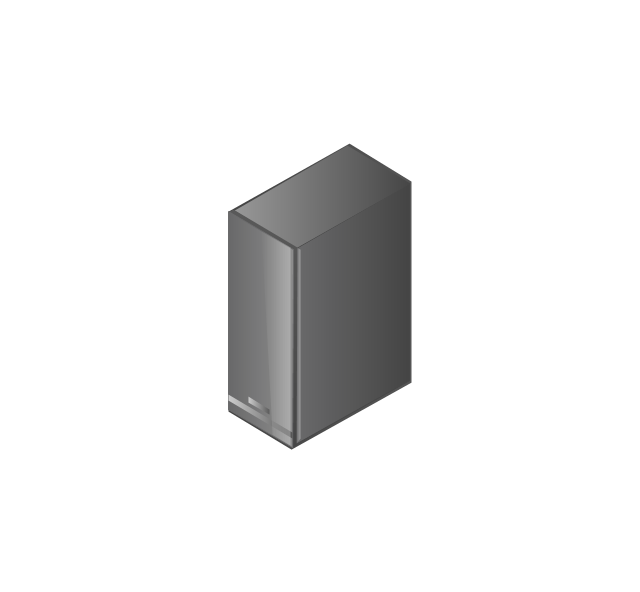
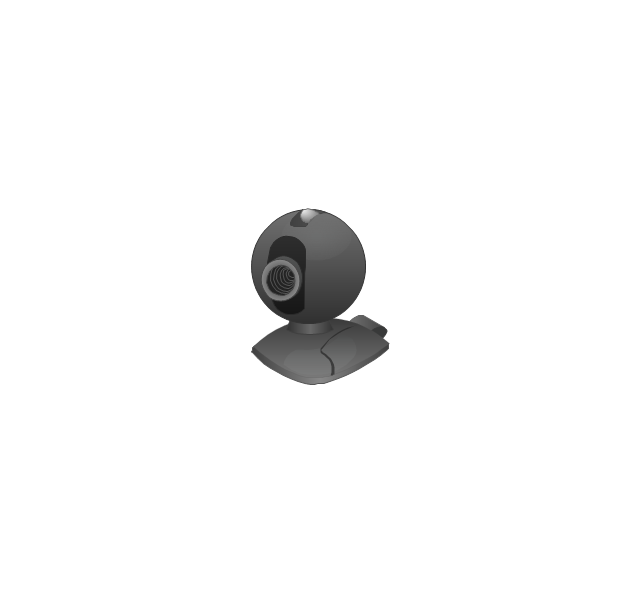
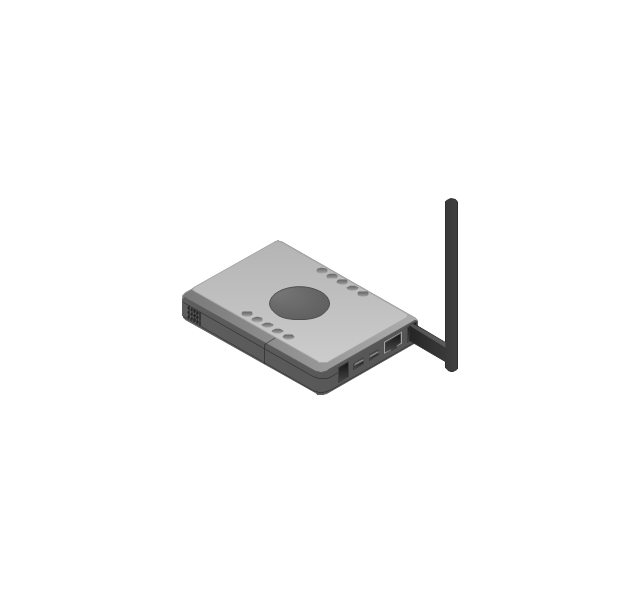
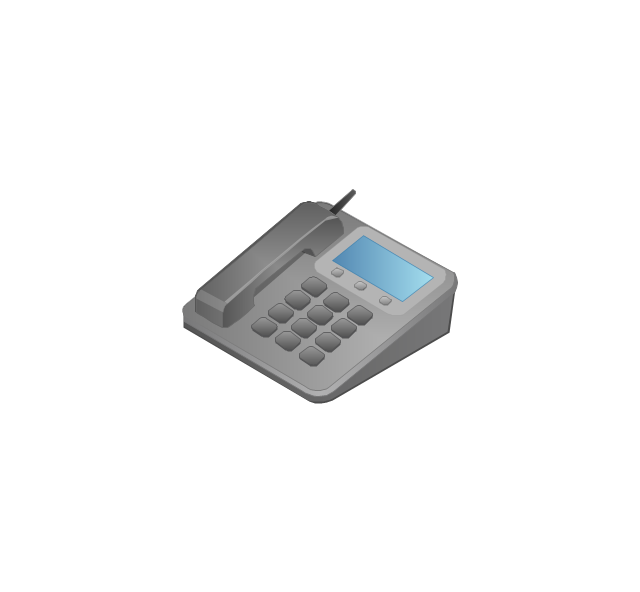
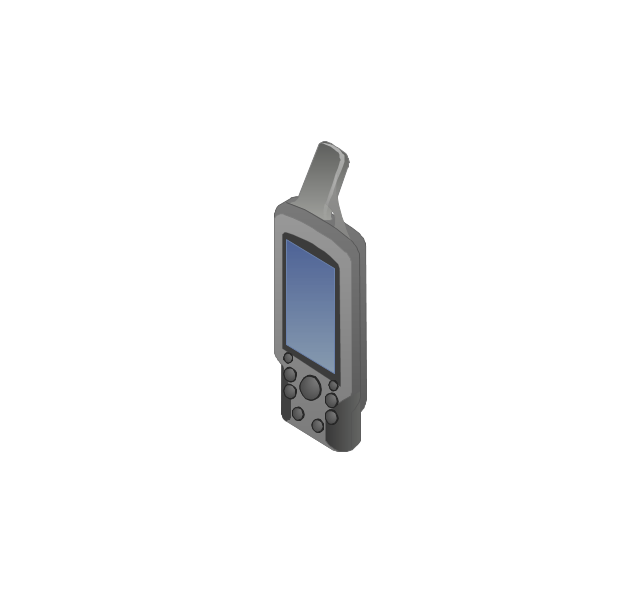
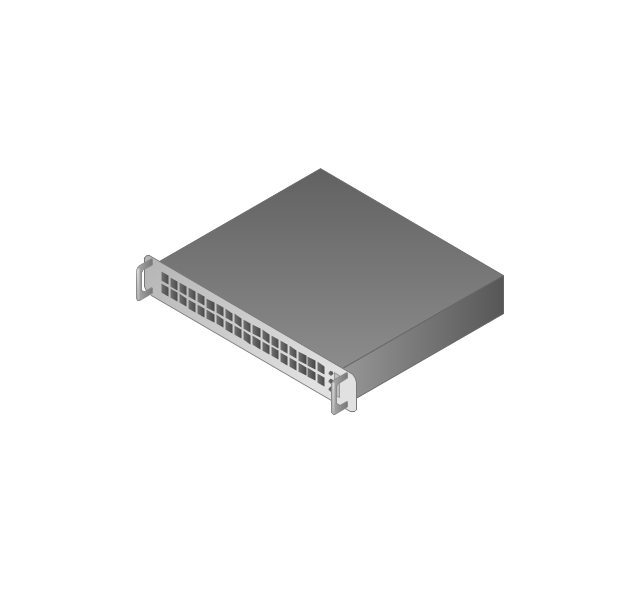
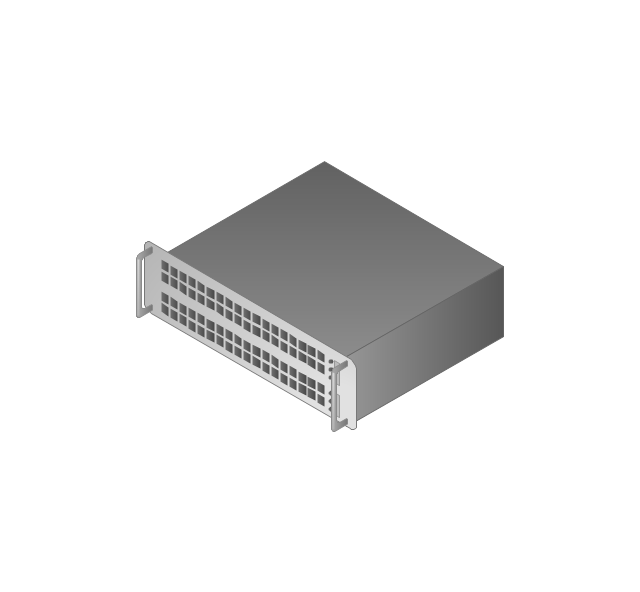
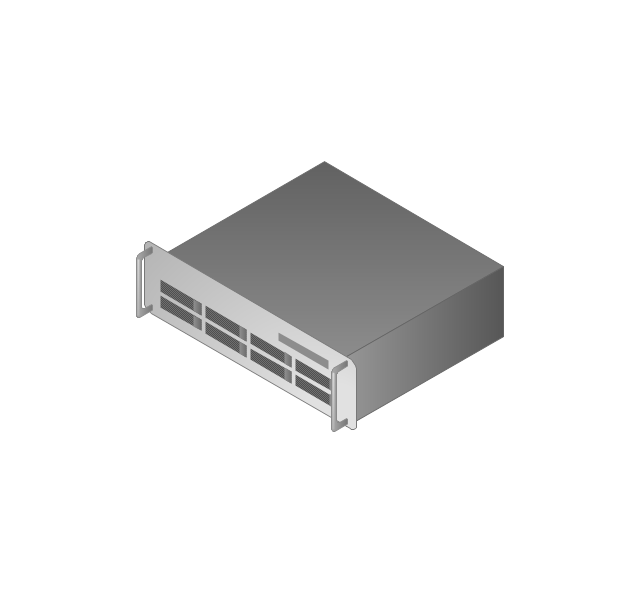
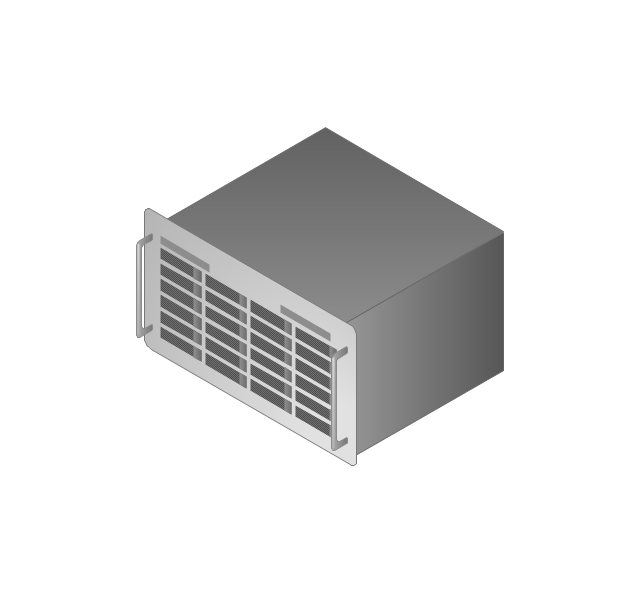
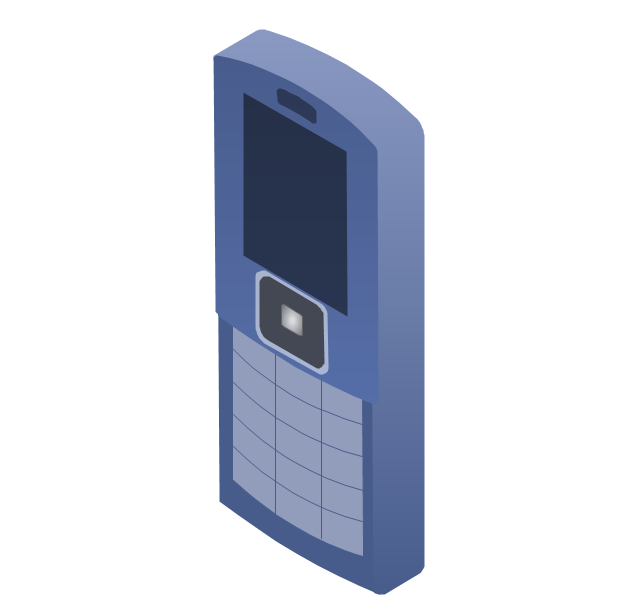
The vector stencils library "Computers and network isometric" contains 56 3D clipart images of computer and network devices and equipment for drawing network diagrams.
The clip art example "Computers and network isometric - Vector stencils library" was created using the ConceptDraw PRO diagramming and vector drawing software extended with the Computer and Networks solution from the Computer and Networks area of ConceptDraw Solution Park.
The clip art example "Computers and network isometric - Vector stencils library" was created using the ConceptDraw PRO diagramming and vector drawing software extended with the Computer and Networks solution from the Computer and Networks area of ConceptDraw Solution Park.
Laptop

DDCS

Server
Webcam
Wireless Network Storage
Personal computer

VoIP phone
Fax
Plotter
Mobile phone
Feature phone

Printer
Satellite dish

Satellite antenna
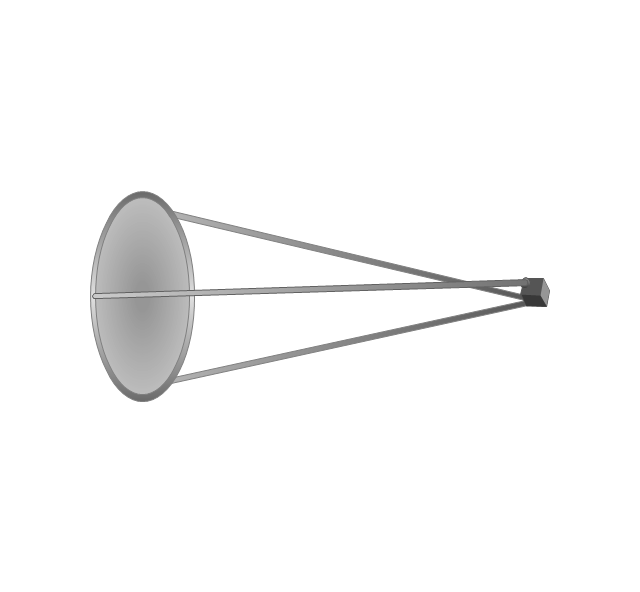
Automatic-tracking satellite dish
Wireless access point
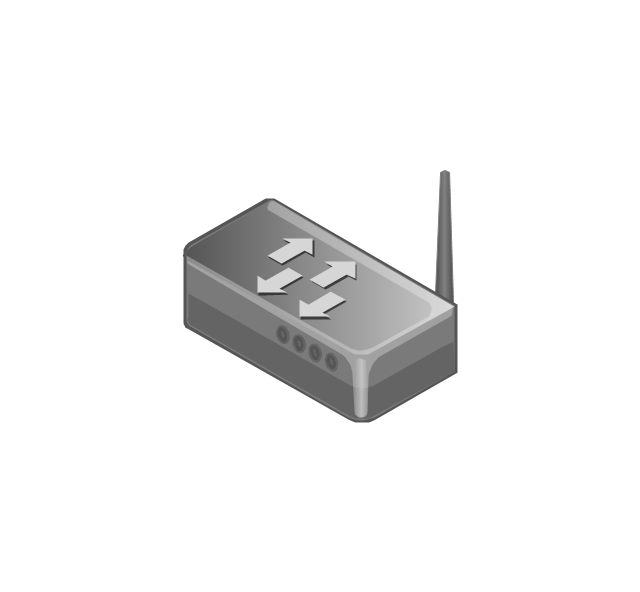
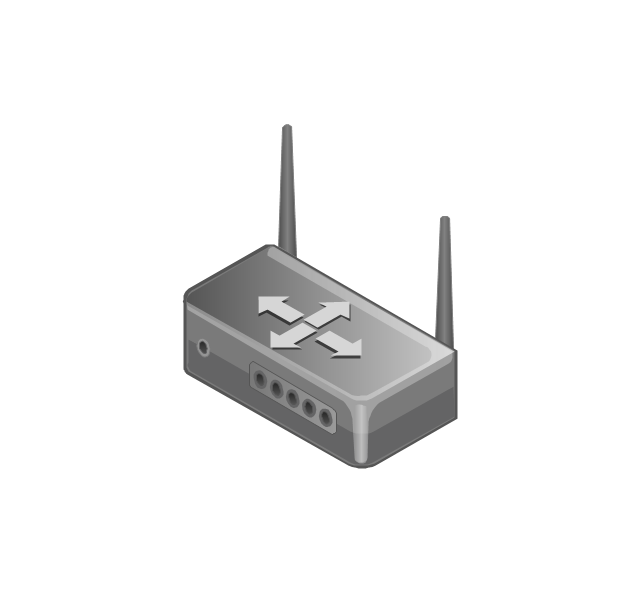
Wireless router
Router
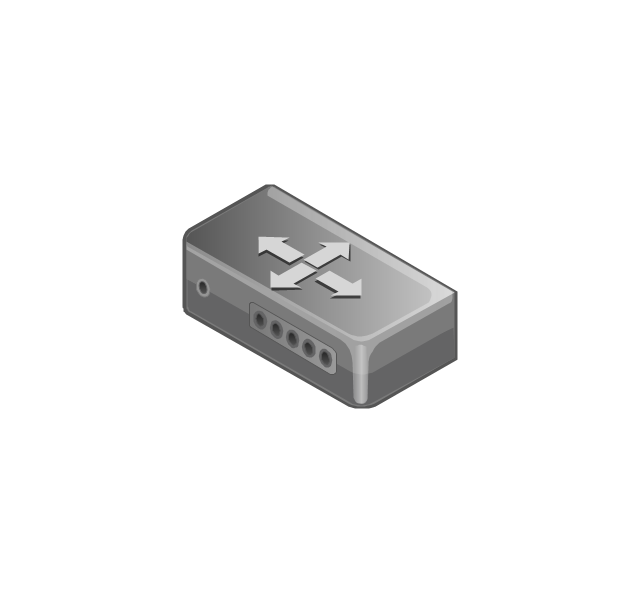
Network switch
Network device
Mobile GPS Terminal
GPS phone
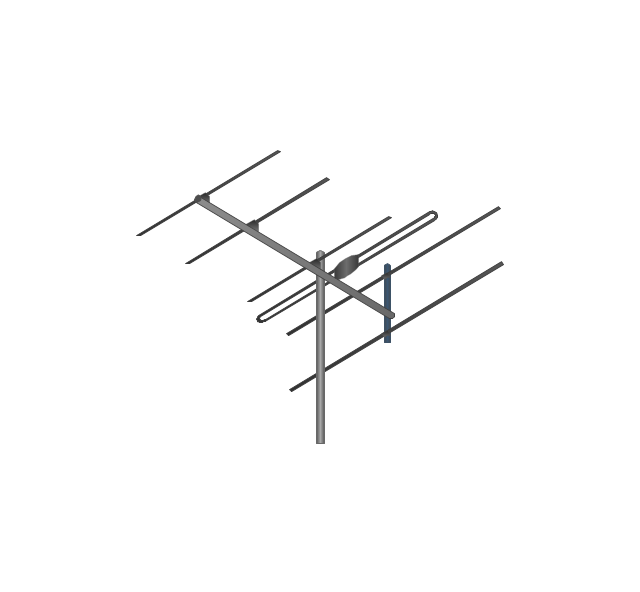
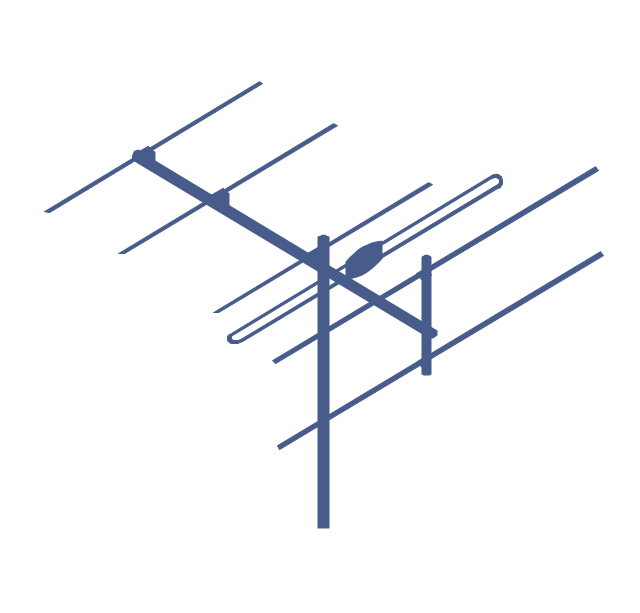
Television antenna
Radio tower

Base station

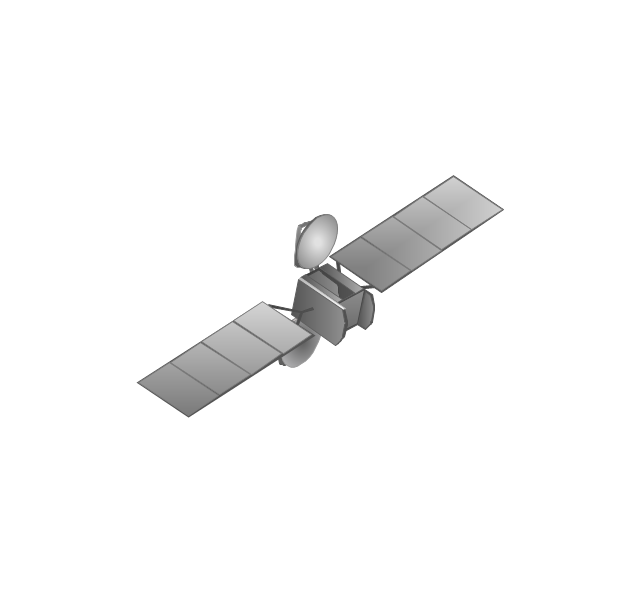
Satellite
In-vehicle satellite telecommunication

Satellite dishes on ship

Airplane

Internet

Man

Woman

Call-center

Honeycomb

Mountain

Radio waves

Radio waves

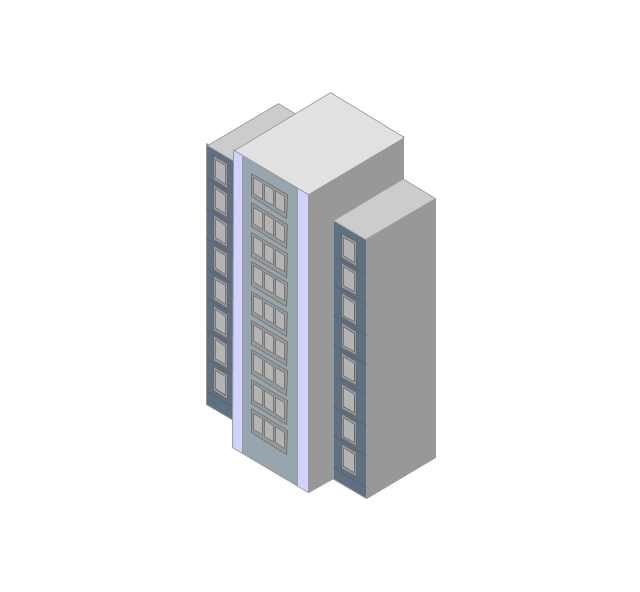
Tower block
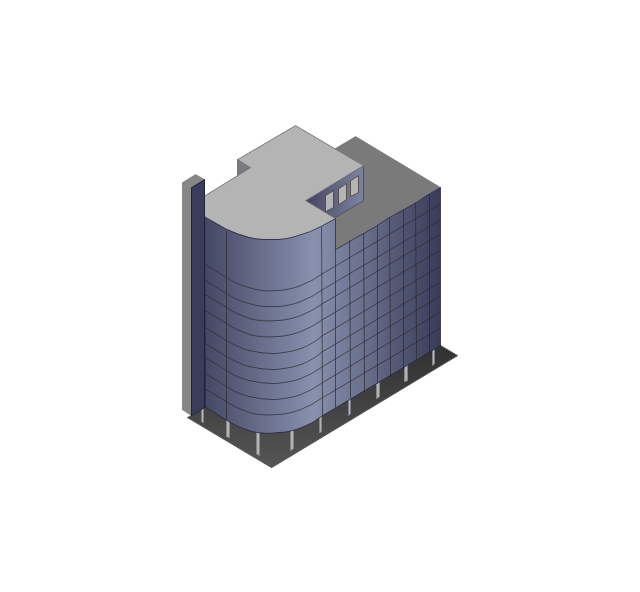
Office building
House

House

Globe

Wireless security camera
Truck

Tree

Conifer tree

1U hub / switch
2U hub / switch
1U server

2U Server
3U Server
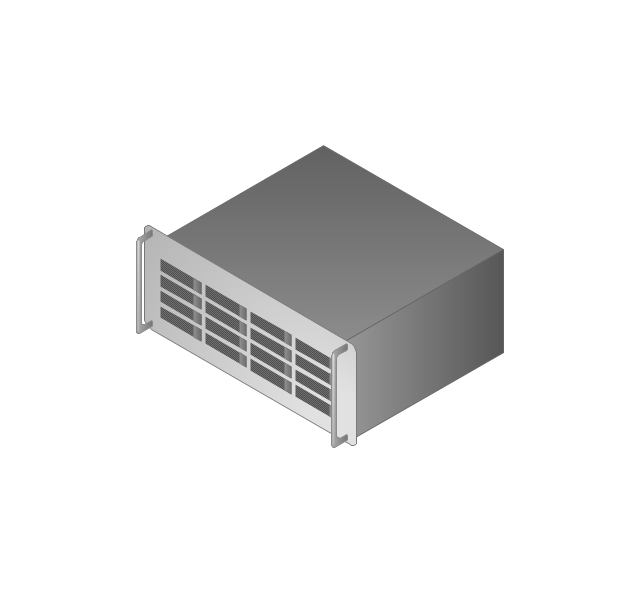
4U Server
Communications satellite
Car

Radio waves

Firewall

Flow chart Example. Warehouse Flowchart


 Line Graphs
How to draw a Line Graph with ease? The Line Graphs solution extends the capabilities of ConceptDraw PRO v10 with professionally designed templates, samples, and a library of vector stencils for drawing perfect Line Graphs.
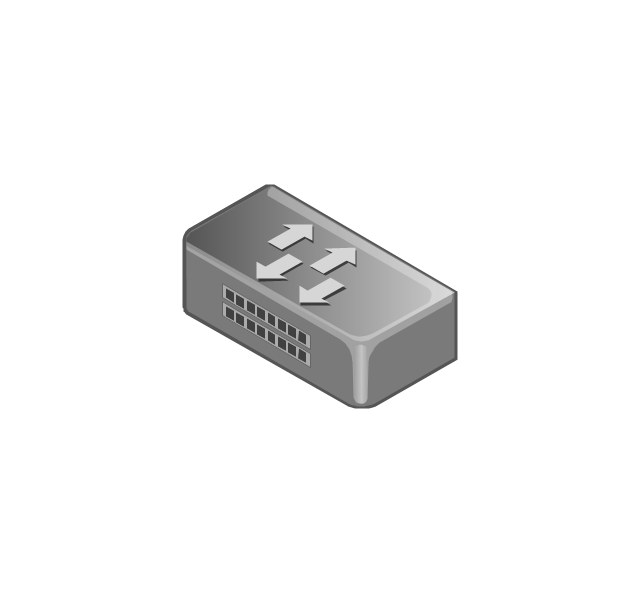
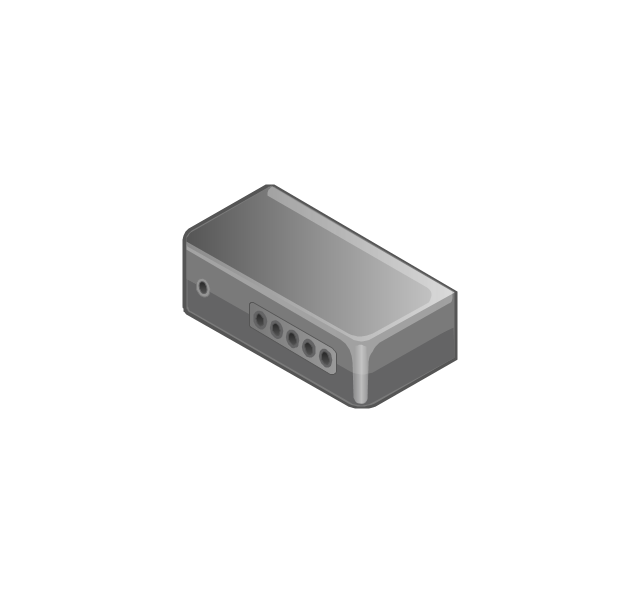
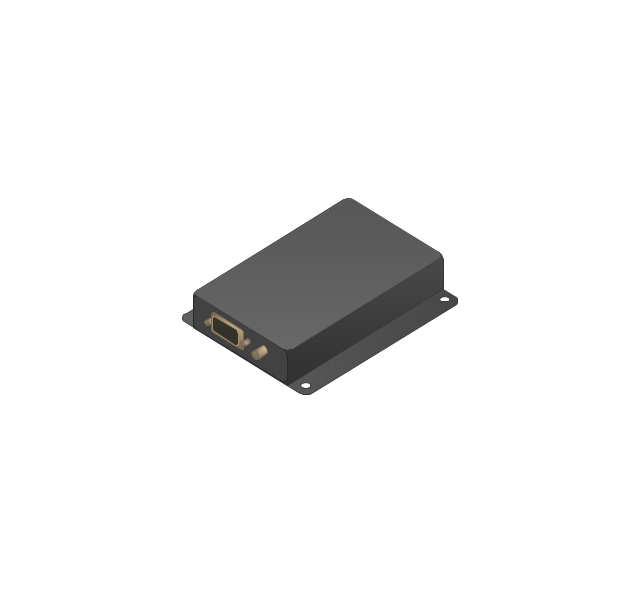
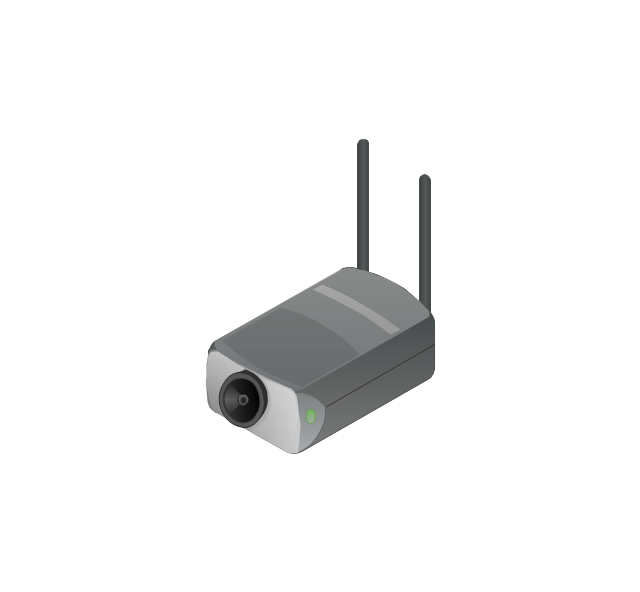
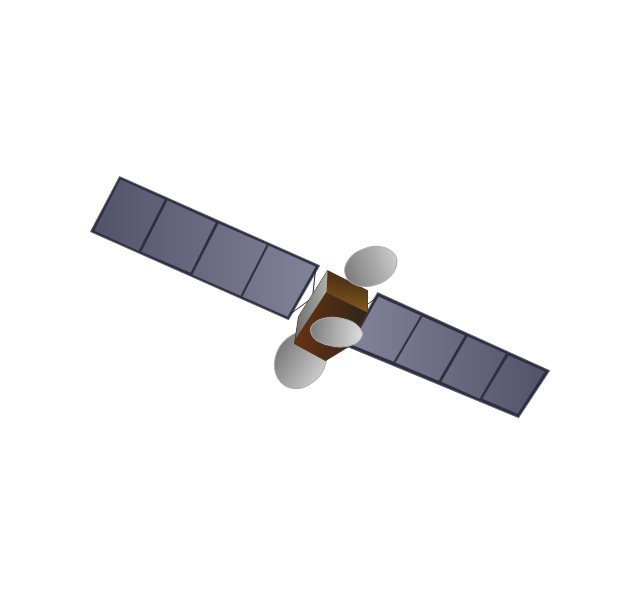
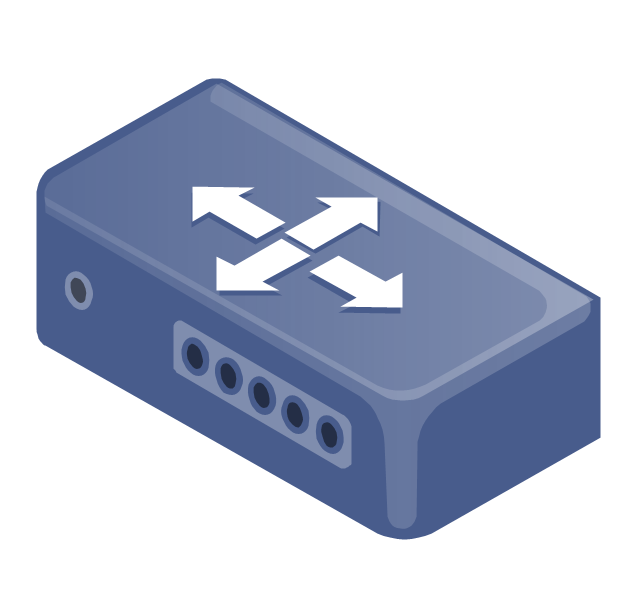
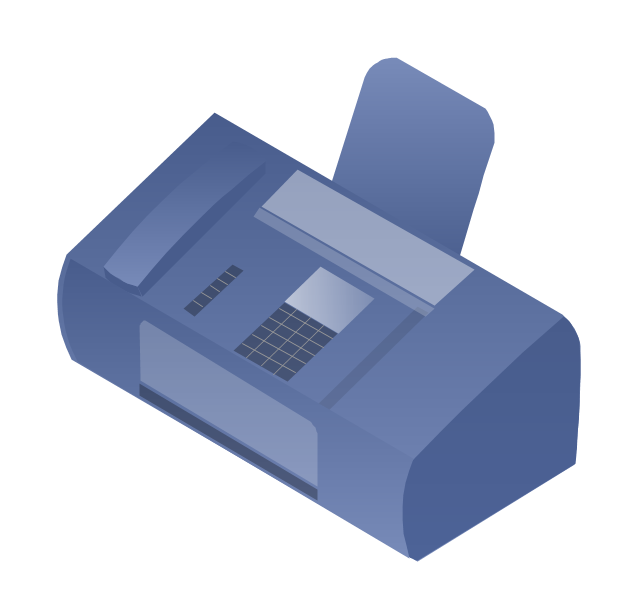
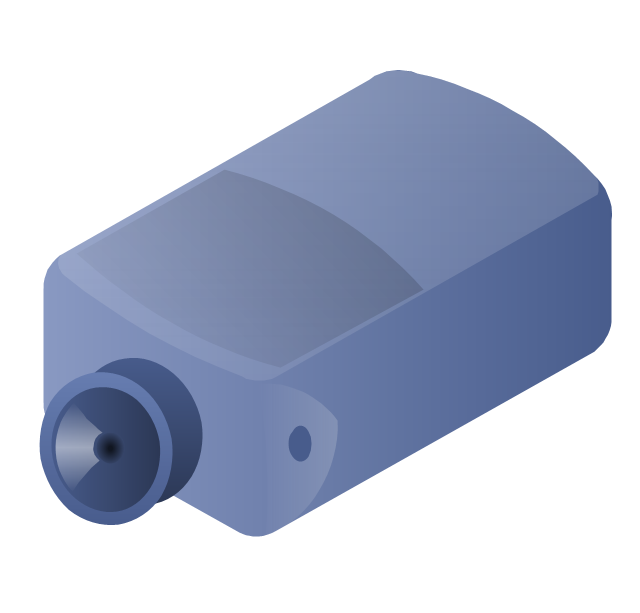
The vector stencils library "Telecommunication networks" contains 32 clipart images of telecommunication network devices and equipment for drawing telecom network diagrams.
"A telecommunications network is a collection of terminal nodes, links and any intermediate nodes which are connected so as to enable telecommunication between the terminals.
The transmission links connect the nodes together. The nodes use circuit switching, message switching or packet switching to pass the signal through the correct links and nodes to reach the correct destination terminal.
Each terminal in the network usually has a unique address so messages or connections can be routed to the correct recipients. The collection of addresses in the network is called the address space." [Telecommunications network. Wikipedia]
The clip art example "Telecommunication networks - Vector stencils library" was created using the ConceptDraw PRO diagramming and vector drawing software extended with the Telecommunication Network Diagrams solution from the Computer and Networks area of ConceptDraw Solution Park.
Internet

Globe

Base station

Satellite dish

Satellite dish

Communications satellite

Wireless cell tower

Radio waves

Radio waves

Cellular phone
Server

Laptop computer

Desktop computer

Car

Satellite truck

House

House

Office building

Mountain

Tree

Tree

User

Call-center

Multi-storey

Antenna
Router
IP phone

Fax
Network cell

IP Camera
Wireless router

Networking device
The vector stencils library "Audio" contains 91 audio, sound and music icons. Use it to design your audio, video and multimedia illustrations, presentations, web pages and infographics with ConceptDraw PRO diagramming and vector drawing software.
"Digital audio refers to technology that can be used to record, store, generate, manipulate, and reproduce sound using audio signals encoded in digital form. Following significant advances in digital audio technology during the 1970s, it rapidly replaced analog audio technology in most areas of sound production, sound engineering and telecommunications. Sound is converted to an analog electrical signal by a microphone, then an analog-to-digital converter (ADC), typically using pulse-code modulation, is used to convert it to a digital signal. A digital-to-analog converter performs the reverse process, converting a digital signal back into an analog signal, which can be converted to an audible sound by a loudspeaker. Digital audio systems may include compression, storage, processing and transmission components. Conversion to a digital format allows convenient manipulation, storage, transmission and retrieval of an audio signal." [Digital audio. Wikipedia]
The vector stencils library "Audio" is included in the Audio, Video, Media solution from the Illustration area of ConceptDraw Solution Park.
Audio wave

Mute

Volume

Music

Note

Notes

Music keys

Piano

Acoustic guitar

Guitar 1

Guitar 2

Electric guitar

Violin

Gramophone

Trumpet

Accordion

Microphone 1

Microphone 2

Microphone 3

Microphone 4

Microphone 5

Turn off microphone

Wire microphone

Mic 1

Mic 2

Karaoke

Singer

Megaphone 1

Megaphone 2

Loudspeaker

Bluetooth earpiece

Headset ear hook

Earphones 1

Earphones 2

Headset 1

Headset 2

Headset 3

Headphones 1

Headphones 2

Headphones 3

Headphones 4

Music player

Audio system

Stereo music system

Music system

Home theatre 1

Home theatre 2
Amplifier 1

Amplifier 2

Loudspeaker 1

Loudspeaker 2

Loudspeaker sound waves

Speaker 1

Speaker 2

Speaker box

Woofer

Woofer speaker

Subwoofer 1

Subwoofer 2

Stereo

Sound control

Vinyl

Audio cassette 1

Audio cassette 2

Cassette

Audio tape

Turntable

Record player

Cassette player

Tape player

Boombox 1

Boombox 2

Boombox 3

Portable radio

Radio set

Radio 1

Radio 2

Mixer

Equalizer 1

Equalizer 2

Equalizer 3

Volume adjuster

Volume control

DJ

Mixer table

Midi

Piano keyboard

Audio file

Music album

Audio cable 1

Audio cable 2

 Basic Line Graphs
This solution extends the capabilities of ConceptDraw PRO v10.3.0 (or later) with templates, samples and a library of vector stencils for drawing Line Graphs.
 Wireless Networks
The Wireless Networks Solution extends ConceptDraw PRO software with professional diagramming tools, set of wireless network diagram templates and samples, comprehensive library of wireless communications and WLAN objects to help network engineers and designers efficiently design and create Wireless network diagrams that illustrate wireless networks of any speed and complexity, and help to identify all required equipment for construction and updating wireless networks, and calculating their costs.
 Artwork
Artwork solution extends ConceptDraw PRO software with illustration samples, templates and libraries of vector clipart of architecture, food, music, funny animals, aquatic fauna and transport.
 Area Charts
Area Charts are used to display the cumulative totals over time using numbers or percentages; or to show trends over time among related attributes. The Area Chart is effective when comparing two or more quantities. Each series of data is typically represented with a different color, the use of color transparency in an object’s transparency shows overlapped areas and smaller areas hidden behind larger areas.
- Wifi Wave Circle Icon Png
- Circle Wave
- Waves Circle Png
- Circle Laptop Png
- Circular Waves
- Sound Wave Circle
- Circle Radio Wave
- Crystal Mapping | Virtuous circle (macroeconomics) - Crystal ...
- Sound Wave Png
- Video Library Circle Png
- Png Vector Images Circle
- One Honeycomb Png
- Circle 4 Phases Png
- Laptop Circle Icon Png Image
- Sine Waves Vector Png
- CASA exposition | What Is a Circle Spoke Diagram | Basic Circle ...
- Electric Waves Png
- Phone Logo Png Circle
- Green Circle Vector Png
- Sound Waves Clipart Png