This site uses cookies. By continuing to browse the ConceptDraw site you are agreeing to our Use of Site Cookies.

3 Circle Venn. Venn Diagram Example

This example shows the 3 Circle Venn Diagram. The Venn Diagrams visualize all possible logical intersections between several sets. On this example you can see the intersections of 3 sets. Venn Diagrams are widely used in mathematics, logic, statistics, marketing, sociology, etc.

Flowchart design. Flowchart symbols, shapes, stencils and icons

A flowchart is a type of diagram that represents an algorithm, workflow or process, showing the steps as boxes of various kinds - flowchart symbols, and their order by connecting them with arrows.
Mavericks have always desired to stand apart and gorgeous design is the recipe for that. Any business graphic document will be more understandable if will use an expository color scheme for their parts. Flowchart design makes versatile presenting and explaining of the process and gives a fresh view that distinguishes it from black and white flowcharts on a paper. Workflow diagram or process flow diagrams become more understandable to ordinary people when it use minimum symbols and special signs.
The best design can be accomplished by starting from any of the suitable Conceptdraw examples. Pick one of them and begin to input proper text into each Flowchart symbols and shapes. Apply less colors in the document and don't turn into rainbow your diagram, three or four will be enough, also note that business process flowchart may not contain bright color hues. The next clue is to use identical colors for same flowchart shape types.
Business Process Modeling with ConceptDraw
Business Process Modeling with ConceptDraw "Business Process Diagrams" Solution
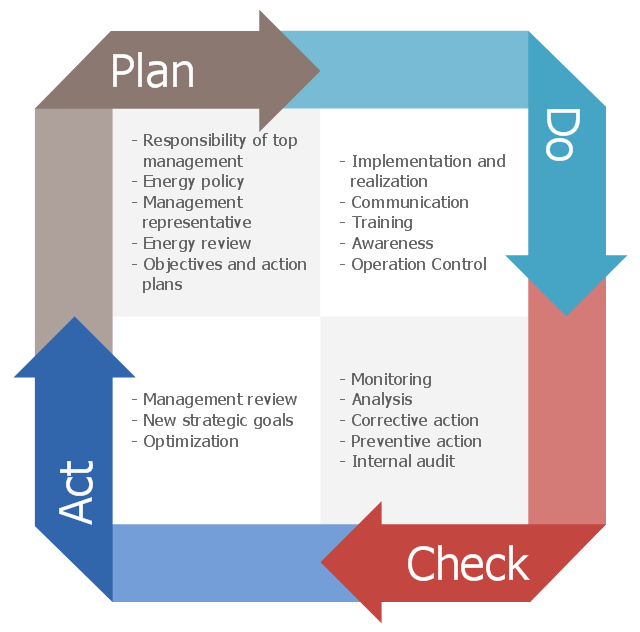
This Deming cycle sample shows plan-do-check-act diagram.
It was designed on the base of Wikimedia Commons file: PDCA ZIRKEL ENGL.png.
"The picture describes the 4 phases of the PDCA circle based on the specification ISO 50001." [commons.wikimedia.org/ wiki/ File:PDCA_ ZIRKEL_ ENGL.png]
This file is licensed under the Creative Commons Attribution-Share Alike 3.0 Unported license. [creativecommons.org/ licenses/ by-sa/ 3.0/ deed.en]
The plan-do-check-act diagram example "PDCA cycle" was designed using ConceptDraw PRO software extended with Plan-Do-Check-Act (PDCA) solution from Management area of ConceptDraw Solution Park.
Diagram example
Diagram example, pdca cycle,

What Is a Circle Spoke Diagram

What Is a Circle Spoke Diagram? It is a diagram which have a central item surrounded by other items in a circle. The Circle Spoke Diagrams are often used to show the features or components of the central item in marketing and management documents and presentations. ConceptDraw PRO extended with Circle-Spoke Diagrams Solution from the "Diagrams" Area is the best software for creating Circle-Spoke Diagrams.

Business Process Flowchart Symbols

The business process flowchart symbols used for business process mapping are predefined by Business Process Modeling Notation (BPMN) and actually have their roots in the data processing diagrams and programming flow charts. Business Process flowchart symbols provide drawing business process flowcharts, diagrams and maps of any complexity.

3 Circle Venn Diagram. Venn Diagram Example

This template shows the Venn Diagram. It was created in ConceptDraw PRO diagramming and vector drawing software using the ready-to-use objects from the Venn Diagrams Solution from the "Diagrams" area of ConceptDraw Solution Park.
Venn Diagrams visualize all possible logical intersections between several sets and are widely used in mathematics, logic, statistics, marketing, sociology, etc.

deming cycle, plan do study act, pdca cycle Plan-Do-Check-Act (PDCA)

deming cycle, plan do study act, pdca cycle
Plan-Do-Check-Act (PDCA) solution extends the ConceptDraw PRO software with collection of samples and predesigned vector objects for easy visualization four stages of PDCA cycle, PDSA cycle, or Deming cycle, for illustration effective application of this method to the practical business tasks, for depiction the implementation of changes and solution the problems in business processes. Plan-Do-Check-Act (PDCA) solution helps to design professional-looking and attractive Plan Do Study Act diagrams, PDCA cycle diagrams, PDCA Process diagrams, and to construct the Quality Management Process Models, which all assist to manage efficiently the business processes, to improve quality of work and to reduce significantly the costs.

Circle Spoke Diagram Template

ConceptDraw PRO diagramming and vector drawing software offers the Circle Spoke Diagram Template included in the Circle-Spoke Diagrams Solution from the "Diagrams" Area. Use of ready template is the easiest way of drawing professional looking Circle-Spoke Diagrams.

Entity Relationship Diagram Symbols

Creating an entity-relationship (ER) model is to visually represent the structure of a business database, where data equates to entities (or objects) that are linked by defined relationships expressing dependencies and requirements. By nature it is an abstract visualization, the first step in the design process towards creating a logical and functional database.
ERD symbols used for professional ERD drawing are collected in libraries from the Entity-Relationship Diagram (ERD) solution for ConceptDraw PRO.

Flowchart Definition

Flowchart definition - A Flowchart is a graphically representation of the structure of process or system, algorithm or the step-by-step solution of the problem. The Flowchart describes the flow of data through an information processing systems and the parts of the flows. The flow is a set of the logic operations that meet the certain requirements.