This site uses cookies. By continuing to browse the ConceptDraw site you are agreeing to our Use of Site Cookies.

How To Create Onion Diagram

An onion diagram is a kind of chart that shows the dependencies among parts of an organization or process. The chart displays items in concentric circles, where the items in each ring depend on the items in the smaller rings. The Onion Diagram is able to show layers of a complete system in a few circles.
But how to create Onion Diagram? Now, it's very easy thanks to the ConceptDraw PRO diagramming and vector drawing software extended with Stakeholder Onion Diagrams Solution from the Management Area of ConceptDraw Solution Park.

Basic Flowchart Symbols and Meaning

Flowchart Symbols and Meaning - Provides a visual representation of basic flowchart symbols and their proposed use in professional workflow diagram, standard process flow diagram and communicating the structure of a well-developed web site, as well as their correlation in developing on-line instructional projects. See flowchart's symbols by specifics of process flow diagram symbols and workflow diagram symbols.
How to Build a Flowchart

Flowchart design. Flowchart symbols, shapes, stencils and icons

A flowchart is a type of diagram that represents an algorithm, workflow or process, showing the steps as boxes of various kinds - flowchart symbols, and their order by connecting them with arrows.
Mavericks have always desired to stand apart and gorgeous design is the recipe for that. Any business graphic document will be more understandable if will use an expository color scheme for their parts. Flowchart design makes versatile presenting and explaining of the process and gives a fresh view that distinguishes it from black and white flowcharts on a paper. Workflow diagram or process flow diagrams become more understandable to ordinary people when it use minimum symbols and special signs.
The best design can be accomplished by starting from any of the suitable Conceptdraw examples. Pick one of them and begin to input proper text into each Flowchart symbols and shapes. Apply less colors in the document and don't turn into rainbow your diagram, three or four will be enough, also note that business process flowchart may not contain bright color hues. The next clue is to use identical colors for same flowchart shape types.
Business Process Modeling with ConceptDraw
Business Process Modeling with ConceptDraw "Business Process Diagrams" Solution

Business Process Elements: Events

Create professional business process diagrams using ConceptDraw Events library with 17 objects from BPMN.
HelpDesk

How to Create a Timeline Diagram in ConceptDraw PRO

A Timeline is a chart which displays a project plan schedule in chronological order. A Timeline is used in project management to depict project milestones and visualize project phases, and show project progress. The graphic form of a timeline makes it easy to understand critical project milestones, such as the progress of a project schedule. Timelines are particularly useful for project scheduling or project management when accompanied with a Gantt chart. It captures the main of what the project will accomplish and how it will be done. making a project timeline is one of the most important skills a project manager needs have. Making comprehensive, accurate timelines allows you getting every project off in the best way. ConceptDraw PRO allows you to draw a timeline charts using special library.

Onion Diagram Process Design

Onion diagram is a type of circular diagram that consists of the core circle representing the product/solution and concentric circles around it, which dependent on the core and look like the cross sections of onion.
ConceptDraw PRO diagramming and vector drawing software supplied with Stakeholder Onion Diagrams Solution from the Management Area of ConceptDraw Solution Park is an ideal software for effective Onion diagram process design.

Stakeholder Mapping Tool

Stakeholders are the groups of people or organizations whose contribution matters to the organization's success, this can be labour participation, financial participation, dissemination of information about organization, etc. So, the employees of the company, its suppliers, customers, media, public organizations, state authorities, all they are stakeholders of the company.
ConceptDraw PRO diagramming and vector drawing software extended with Stakeholder Onion Diagrams Solution from the Management Area of ConceptDraw Solution Park is a powerful stakeholder mapping tool which allows easy create Stakeholder Onion diagrams and maps depicting the layers of a project, relationships of stakeholders to a project goal, and relationships between stakeholders.
HelpDesk

How to Create an AWS Architecture Diagram

Displaying an Amazon Web Service (AWS) cloud actually requires large amounts of attention to detail. Every element of technology has to be addressed: software, middle ware, transaction processing, scaling, data storage; the complete list is staggering. Using the ConceptDraw AWS Architecture Diagrams solution makes much easier the work on documenting the Amazon Web Service architecture. The ConceptDraw AWS Architecture Diagrams solution includes icons, sample and templates for some Amazon Web Services products and resources, to be used when buiding architecture diagrams. The icons are simple so that user can easily incorporate them in his drawings. AWS Architecture Diagrams can be used in presentations, datasheets, or any other technical visualizations.
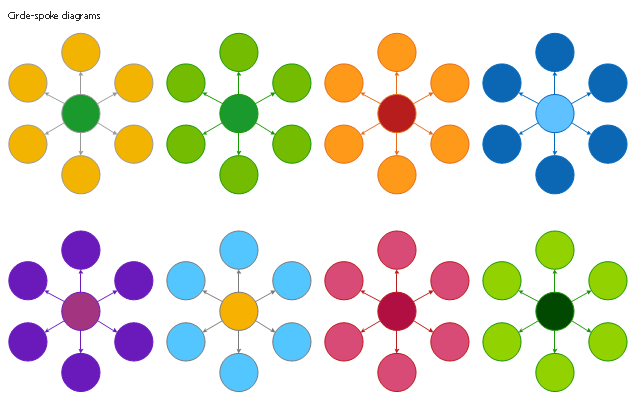
The vector stencils library "Circle-spoke diagram" contains 8 templates for the ConceptDraw PRO diagramming and vector drawing software.
Circle-Spoke Diagrams (Spoke charts) have a central item surrounded by other items in a circle. The circle-spoke diagram is a diagram meant to illustrate that each spoke has equal value. Circle-spoke diagrams are used to show the relationships between a single main element and several satellites.
The circle-spoke diagrams are used to show the features or components of a central item in marketing, management documents and presentations.
The example "Design elements - Circle-spoke diagram" is included in the Circle-Spoke Diagrams solution from the area "What is a Diagram" of ConceptDraw Solution Park.
Circle spoke diagram templates
Circle spoke diagram templates, circle-spoke diagram,

ConceptDraw Solution Park ConceptDraw Solution Park

ConceptDraw Solution Park
ConceptDraw Solution Park collects graphic extensions, examples and learning materials

graphical user interface, UI patterns, GUI interface iPhone User Interface

graphical user interface, UI patterns, GUI interface
iPhone User Interface solution extends ConceptDraw PRO v10 software with templates, samples and libraries with large quantity of vector stencils of graphical user interface elements, Apps icons, UI patterns for designing and prototyping of the iOS applic

ConceptDraw Solution Park ConceptDraw Solution Park

ConceptDraw Solution Park
ConceptDraw Solution Park collects graphic extensions, examples and learning materials
The vector stencils library "Circular diagrams" contains 42 templates of circular diagrams: circular arrow diagram, circular motion diagram, arrow ring chart, doughnut chart (donut chart), circle pie chart, diamond pie chart, circle diagram, pie chart, ring chart, loop diagram, block loop diagram, arrow loop circle, crystal diagram, triangular diagram, diamond diagram, pentagon diagram, hexagon diagram, heptagon diagram, cycle diagram (cycle chart), stacked Venn diagram (onion diagram), arrow circle diagram.
Use these shapes to illustrate your marketing and sales documents, presentations, webpages and infographics in the ConceptDraw PRO diagramming and vector drawing software extended with the Target and Circular Diagrams solution from the Marketing area of ConceptDraw Solution Park.
www.conceptdraw.com/ solution-park/ marketing-target-and-circular-diagrams
Circular arrow diagram 1
Circular arrow diagram 1, circular arrow diagram, circular motion diagram,
Circular arrow diagram 2
Circular arrow diagram 2, circular arrow diagram, circular motion diagram,
Arrow ring chart
Arrow ring chart, circular arrow diagram, circular motion diagram,
Doughnut chart
Doughnut chart, doughnut chart, pie chart, ring chart, donut chart,
Diamond pie chart
Diamond pie chart, diamond pie chart, circular diagram,
Pie chart
Pie chart, pie chart,
Circle diagram
Circle diagram, circle diagram, circular diagram,
Circle pie chart 2
Circle pie chart 2, circle pie chart, circular diagram, marketing mix diagram,
Circle pie chart 1
Circle pie chart 1, circle pie chart, circular diagram, marketing mix diagram,
Ring chart 1 - 3 elements
Ring chart 1 - 3 elements, doughnut chart, pie chart, ring chart, donut chart,
Ring chart 1 - 4 elements
Ring chart 1 - 4 elements, doughnut chart, pie chart, ring chart, donut chart,
Ring chart 1 - 5 elements
Ring chart 1 - 5 elements, doughnut chart, pie chart, ring chart, donut chart,
Ring chart 1 - 6 elements
Ring chart 1 - 6 elements, doughnut chart, pie chart, ring chart, donut chart,
Ring chart 1 - 7 elements
Ring chart 1 - 7 elements, doughnut chart, pie chart, ring chart, donut chart,
Ring chart 2 - 3 elements
Ring chart 2 - 3 elements, doughnut chart, pie chart, ring chart, donut chart,
Ring chart 2 - 4 elements
Ring chart 2 - 4 elements, doughnut chart, pie chart, ring chart, donut chart,
Ring chart 2 - 5 elements
Ring chart 2 - 5 elements, doughnut chart, pie chart, ring chart, donut chart,
Ring chart 2 - 6 elements
Ring chart 2 - 6 elements, doughnut chart, pie chart, ring chart, donut chart,
Ring chart 2 - 7 elements
Ring chart 2 - 7 elements, doughnut chart, pie chart, ring chart, donut chart,
Crystal diagram - 3 elements
Crystal diagram - 3 elements, crystal diagram, triangular diagram,
Crystal diagram - 4 elements
Crystal diagram - 4 elements, crystal diagram, diamond diagram,
Crystal diagram - 5 elements
Crystal diagram - 5 elements, crystal diagram, pentagon diagram,
Crystal diagram - 6 elements
Crystal diagram - 6 elements, crystal diagram, hexagon diagram,
Crystal diagram - 7 elements
Crystal diagram - 7 elements, crystal diagram, heptagon diagram,
Stacked Venn diagram - 4
Stacked Venn diagram - 4, stacked Venn diagram, onion diagram,
Stacked Venn diagram - 5
Stacked Venn diagram - 5, stacked Venn diagram, onion diagram,
Stacked Venn diagram - 6
Stacked Venn diagram - 6, stacked Venn diagram, onion diagram,
Stacked Venn diagram - 7
Stacked Venn diagram - 7, stacked Venn diagram, onion diagram,
Basic loop diagram
Basic loop diagram, basic loop diagram,
Block loop diagram
Block loop diagram, block loop diagram,
Arrow loop circle
Arrow loop circle, arrow loop circle,
Arrow loop - 3 circles
Arrow loop - 3 circles, arrow loop diagram,
Arrow loop - 4 circles
Arrow loop - 4 circles, arrow loop diagram,
Arrow loop - 5 circles
Arrow loop - 5 circles, arrow loop diagram,
Arrow loop - 6 circles
Arrow loop - 6 circles, arrow loop diagram,
Arrow loop - 7 circles
Arrow loop - 7 circles, arrow loop diagram,
Arrow circle diagram - 3
Arrow circle diagram - 3, arrow circle diagram,
Arrow circle diagram - 4
Arrow circle diagram - 4, arrow circle diagram,
Stacked Venn diagram - 3
Stacked Venn diagram - 3, stacked Venn diagram, onion diagram,
Arrow circle diagram - 5
Arrow circle diagram - 5, arrow circle diagram,
Arrow circle diagram - 6
Arrow circle diagram - 6, arrow circle diagram,
Arrow circle diagram - 7
Arrow circle diagram - 7, arrow circle diagram,