Types of Flowchart - Overview


Gant Chart in Project Management


How to Discover Critical Path on a Gantt Chart

Process Flowchart


Bar Diagrams for Problem Solving. Create business management bar charts with Bar Graphs Solution

Bar Diagrams for Problem Solving. Create event management bar charts with Bar Graphs Solution

Social Media Response Management DFD Charts - software tools


Gantt chart examples

 25 Typical Orgcharts
The 25 Typical Orgcharts solution contains powerful organizational structure and organizational management drawing tools, a variety of professionally designed organization chart and matrix organization structure samples, 25 templates based on various orga
Examples of Flowcharts, Org Charts and More


Percentage Pie Chart. Pie Chart Examples

HelpDesk
How to Create Organizational Chart Using Management Solution

PERT Chart Software

 HR Flowcharts
Human resource management diagrams show recruitment models, the hiring process and human resource development of human resources.
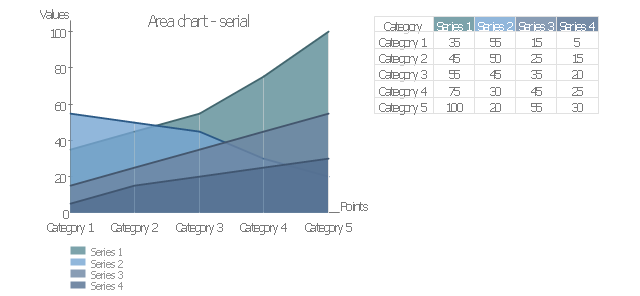
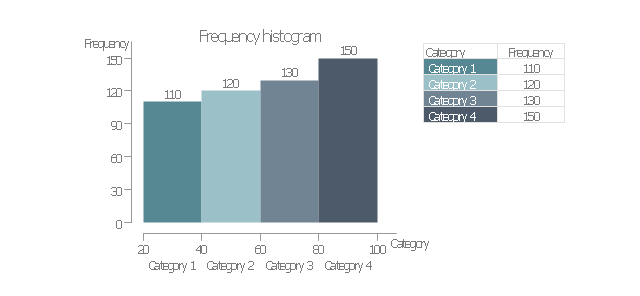
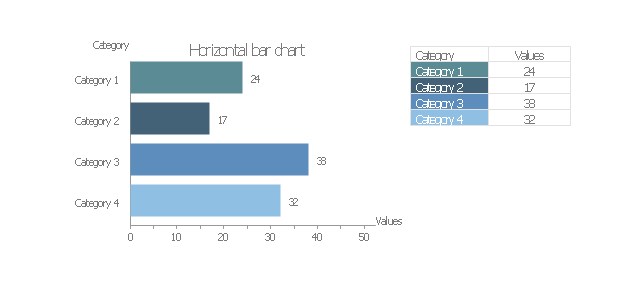
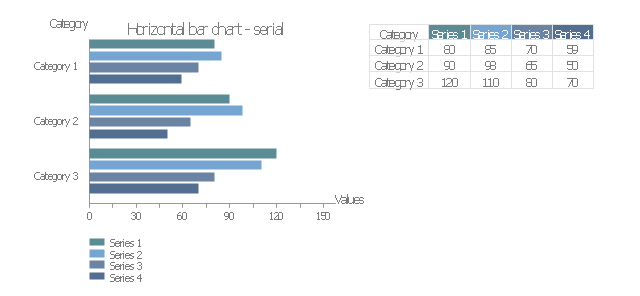
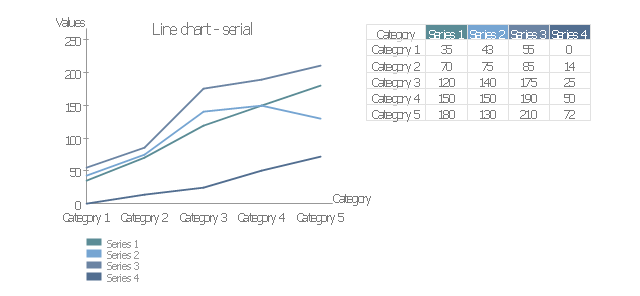
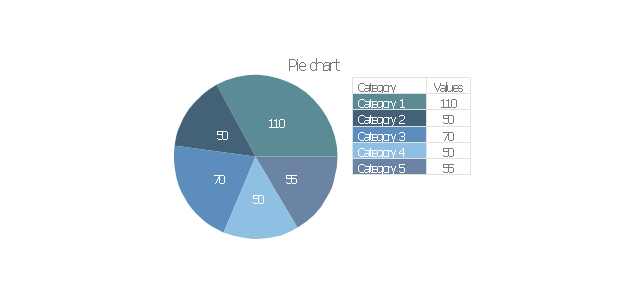
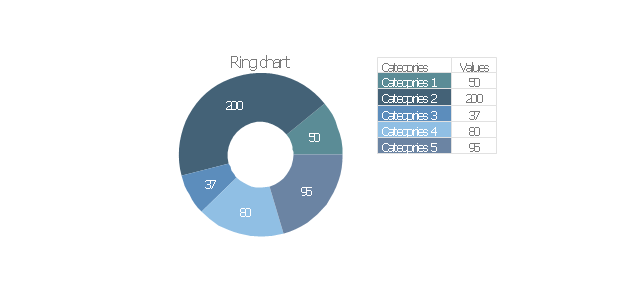
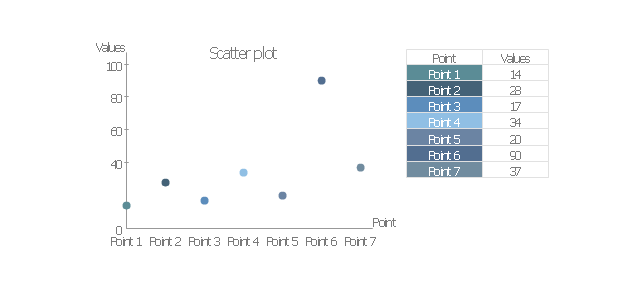
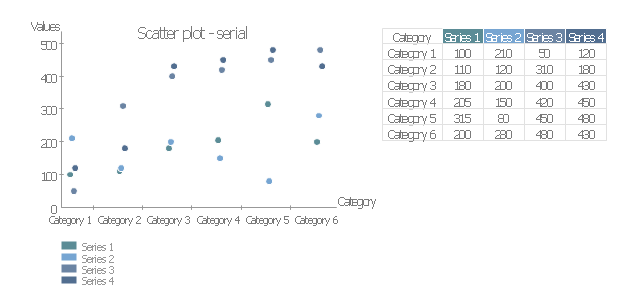
The vector stencils library "Management charts" contains 12 graphs and charts: area chart, column chart, divided bar diagram, histogram, horizontal bar graph, line graph, pie chart, ring chart, scatter plot.
Use it to create your management infogram in the ConceptDraw PRO diagramming and vector drawing software.
The graphs example "Management charts - Vector stencils library" is included in the solution "Marketing infographics" from the "Business infographics" area of ConceptDraw Solution Park.
Use it to create your management infogram in the ConceptDraw PRO diagramming and vector drawing software.
The graphs example "Management charts - Vector stencils library" is included in the solution "Marketing infographics" from the "Business infographics" area of ConceptDraw Solution Park.
Area chart - serial
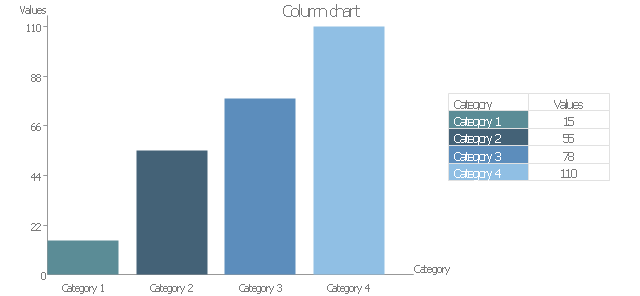
Column chart
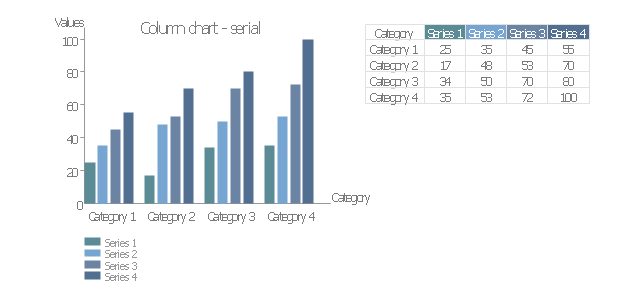
Column chart - serial
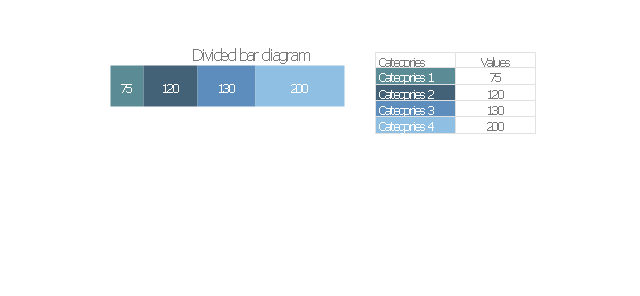
Divided bar diagram
Frequency histogram
Horizontal bar chart
Horizontal bar chart - serial
Line chart - serial
Pie chart
Ring chart
Scatter plot
Scatter plot - serial
- Chart Of Management Information System With Diagram
- Pie Charts | Bar Diagram Math | Sketching Software | Management ...
- Project Management Charts And Graphs
- Flowcharts For Hr Processes
- Management Flow Chart Template
- Flow chart Example. Warehouse Flowchart | SWOT Analysis ...
- Tqm Chart
- Human Resource Development | Gant Chart in Project Management ...
- Gantt chart examples | How to Draw a Gantt Chart Using ...
- Project management life cycle - Flowchart | Program to Make Flow ...
- How to Draw an Organization Chart | ConceptDraw PRO ...
- Flow Chart Of Management Structure Of Any School
- Project management life cycle - Flowchart | Product life cycle ...
- Gantt chart examples | Gant Chart in Project Management | Project ...
- Bar Graph And Pie Chart About Management Of Natural Resourses
- Pie charts - Vector stencils library | Data-driven charts - Vector ...
- Levels Of Management Flow Chart
- Pie Chart About Management Of Natural Resources
- Identifying Quality Management System | Flow chart Example ...
- How to Draw an Organization Chart | Organizational Structure ...