Chart Examples

This organization chart example was redesigned from the Wikimedia Commons file: US Navy Operating Forces Org Chart.png. [commons.wikimedia.org/ wiki/ File:US_ Navy_ Operating_ Forces_ Org_ Chart.png]
"The operating forces commanders and fleet commanders have a dual chain of command. Administratively, they report to the Chief of Naval Operations and provide, train, and equip naval forces. Operationally, they provide naval forces and report to the appropriate Unified Combatant Commanders. Commander Fleet Forces Command commands and controls fleet assets on both the Atlantic and Pacific coasts for interdeployment training cycle purposes. As units of the Navy enter the area of responsibility for a particular Navy area commander, they are operationally assigned to the appropriate numbered fleet. All Navy units also have an administrative chain of command with the various ships reporting to the appropriate Type Commander." [navy.mil/ navydata/ organization/ orgopfor.asp]
The org chart sample "US Navy operating forces" was created using the ConceptDraw PRO diagramming and vector drawing software extended with the 25 Typical Organizational Charts solution from the Management area of ConceptDraw Solution Park.
Org chart

How to Create Presentation of Your Project Gantt Chart

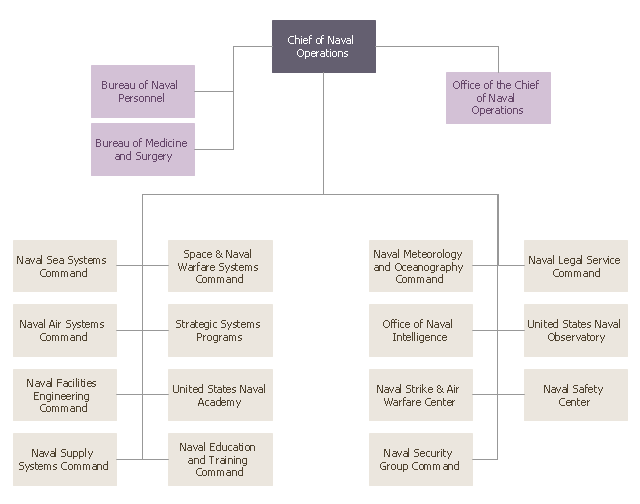
This organization chart example was redesigned from the Wikimedia Commons file: Us Navy Shore Establishment Org Chart.png. [commons.wikimedia.org/ wiki/ File:Us_ Navy_ Shore_ Establishment_ Org_ Chart.png]
"The shore establishment provides support to the operating forces (known as "the fleet") in the form of: facilities for the repair of machinery and electronics; communications centers; training areas and simulators; ship and aircraft repair; intelligence and meteorological support; storage areas for repair parts, fuel, and munitions; medical and dental facilities; and air bases." [navy.mil/ navydata/ organization/ org-shor.asp]
The org chart sample "US Navy shore establishment" was created using the ConceptDraw PRO diagramming and vector drawing software extended with the 25 Typical Organizational Charts solution from the Management area of ConceptDraw Solution Park.
Org chart
Flow Chart Symbols

Chart Templates

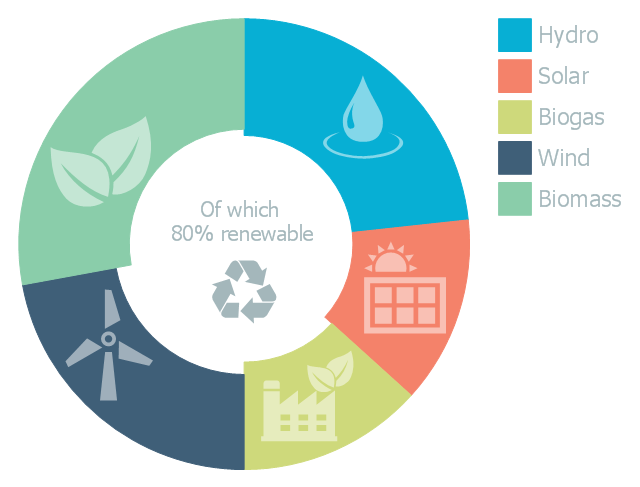
This doughnut chart sample illustrates the renewable energy sources. It was designed on the base of the Wikipedia file: Example of a doughnut chart.png.
[en.wikipedia.org/ wiki/ File:Example_ of_ a_ doughnut_ chart.png]
This file is licensed under the Creative Commons Attribution-ShareAlike 3.0 License. [creativecommons.org/ licenses/ by-sa/ 3.0/ ]
"Renewable energy is generally defined as energy that is collected from resources which are naturally replenished on a human timescale, such as sunlight, wind, rain, tides, waves, and geothermal heat. Renewable energy often provides energy in four important areas: electricity generation, air and water heating/ cooling, transportation, and rural (off-grid) energy services." [Renewable energy. Wikipedia]
The donut chart example "Renewable energy" was created using the ConceptDraw PRO diagramming and vector drawing software extended with the Pie Charts solutiton of the Graphs and Charts area in ConceptDraw Solution Park.
Donut chart
Process Flow Chart Examples

Flowchart design. Flowchart symbols, shapes, stencils and icons


Pyramid Diagram

- Funnel Chart Png
- Chart Templates | Pie Charts | Chart Examples | Percentage Chart Png
- Corporate Chart Vector Png
- Doughnut Chart Png
- Growth Chart Png
- Design elements - Financial charts | Finance Chart Image Png
- Beautiful Bar Chart Image Png
- 3d Bar Graph Png
- Arrow circle chart - Template | Circular diagrams - Vector stencils ...
- Horizontal Bar Graph Png