Biology Drawing

Biology Illustration

Biology Symbols

Biology solution provides 3 libraries with large quantity of vector biology symbols: Biochemistry of Metabolism Library, Carbohydrate Metabolism Library, Citric Acid Cycle (TCA Cycle) Library.
 Biology
Being involved in the study of biology, the ConceptDraw DIAGRAM diagramming and drawing software can be used and so Biology solution as its extension. The last-mentioned tool provides all the ConceptDraw DIAGRAM users with the pre-made biology-related samples and templates as well as the stencil libraries that contain many of the biological vector symbols. In order to create educational and scientific designs in the field of biology and to visually explain some complex knowledge within such sub-disciplines of biology as biochemistry, microbiology, molecular and cell biology, genomics and proteomics, biotechnology and genetics, the Biology solution may be used by any ConceptDraw DIAGRAM user.
 Biomedicine
Biomedicine solution extends ConceptDraw DIAGRAM ector diagramming software with abundance of samples and libraries of vector biomedical icons, pictograms of biomedical sciences and biomedical technologies, the main purpose of which is to help biomedical doctors, biomedical researchers, scientific professionals, professors in biomedical science, technicians, lectors, students to describe visually and to illustrate new achievements and new technologies in biomedical science, results of experiments and tests at this field, to depict the history of biomedicine development, the stages and progress at this field, to plan future biomedicine technologies and to describe those that are now in development or on the stage of testing the biomedical technology by biomedical specialists, to design colorful and professionally looking illustrations, diagrams, presentation slides and infographics in fields of biomedicine, personalized medicine, regenerative medicine, molecular medicine, evidence-based medicine, reconstructive biomedicine, and preventive health care.
Biology Drawing Software

ConceptDraw PROJECT Software Overview

Entity Relationship Diagram - ERD - Software for Design Crows Foot ER Diagrams
_Win_Mac.png "Entity Relationship Diagram - ERD - Software for Design <br>Crows Foot ER Diagrams *")

Flowchart Software

Business and Finance Illustrations Example

Food Pictures

 Basic Circle-Spoke Diagrams
Basic Circle-Spoke Diagrams solution makes ConceptDraw DIAGRAM the best software for creating the Circle-Spoke Diagrams, Circle Diagrams, and Spoke Diagrams. It offers the library of vector stencils, the set of illustrative samples and gives the introduction about what is a circle spoke diagram or what is a spoke diagram. Use any of included samples as a circle spoke diagram template to design a professionally-looking Circle Spoke Diagram of any complexity literally in a few moments and use it in business documentation, report or simply share with colleagues.
Scrum

Beauty in nature Illustrations and Clipart

Online Diagram Tool

Infographic design elements, software tools Subway and Metro style

Flow Chart Creator

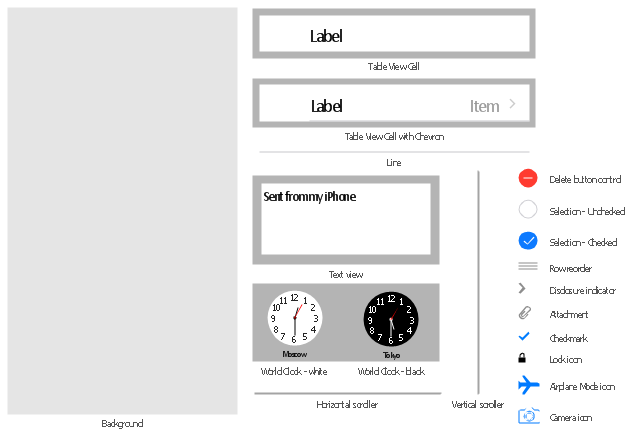
The vector stencils library "Content Views" contains 20 iOS apps GUI content views: table view cell, table view cell with chevron, text view, background, world clock, horizontal and vertical scrollers, delete button, icons: cheked and unchecked selections, row reorder, disclosure indicator, attachment, checkmark, lock, airplane mode, camera. Use it to draw content view elements for design of iPhone software applications user interface sketches, mockups and prototypes.
The iOS GUI views sample "Design elements - Content Views" was created using the ConceptDraw PRO diagramming and vector drawing software extended with the iPhone User Interface solution from the Software Development area of ConceptDraw Solution Park.
The iOS GUI views sample "Design elements - Content Views" was created using the ConceptDraw PRO diagramming and vector drawing software extended with the iPhone User Interface solution from the Software Development area of ConceptDraw Solution Park.
iOS GUI views: Content views
Exam Preparation Mind Map

Biomedical Science

Templates as the “Biomedical Sciences”, “Biomedical Sciences – Life Sciences”, “Biomedical Sciences Physics and Bioengineering”, “Biomedical Sciences – Physiological Science”, “Disease Diagnostics Using Proteomic Patterns”, “Microarray Comparative Genomic Hybridisation”, “Molecular Diagnostics”, “Precision Medicine and Population Health”, “Protein Patterns and Diagnosis” and “Understanding Precision Medicine” may help one to create the smart looking biomedical related representations based on them
- Biology | Biology Drawing Software | Biology Drawing | Biology
- Software For Drawing Cell Biology Diagrams
- Biology Drawing Software | Design elements | Drawing Software Cell
- Biology Symbols | Biology Drawing Software | Biology Illustration ...
- Biology Drawing Software | Softwares To Draw Cell Pathways
- Biology Drawing Software | Biology | Software To Draw Cell
- Biology Drawing Software | Biology | Biological Cell Drawing
- | Cross-Functional Flowchart | How To Draw Cell Cycle Symbol
- Biology Drawing | Biology Illustration | Draw Biology Cell Software