UML Diagram of Parking

 Sport Field Plans
Construction of sport complex, playgrounds, sport school, sport grounds and fields assumes creation clear plans, layouts, or sketches. In many cases you need represent on the plan multitude of details, including dimensions, placement of bleachers, lighting, considering important sport aspects and other special things.
Entity-Relationship Diagram (ERD) with ConceptDraw PRO


 Event-driven Process Chain Diagrams
Event-driven Process Chain (EPC) Diagram is a type of flowchart widely used for modeling in business engineering and reengineering, business process improvement, and analysis. EPC method was developed within the Architecture of Integrated Information Systems (ARIS) framework.
 Aerospace and Transport
This solution extends ConceptDraw PRO software with templates, samples and library of vector clipart for drawing the Aerospace and Transport Illustrations. It contains clipart of aerospace objects and transportation vehicles, office buildings and anci
UML Use Case Diagram. Design Elements
")

 Entity-Relationship Diagram (ERD)
Entity-Relationship Diagram (ERD) solution extends ConceptDraw PRO software with templates, samples and libraries of vector stencils from drawing the ER-diagrams by Chen's and crow’s foot notations.
 Site Plans
Vivid and enticing plan is the starting point in landscape design and site plan design, it reflects the main design idea and gives instantly a vision of the end result after implementation of this plan. Moreover site plan, architectural plan, detailed engineering documents and landscape sketches are obligatory when designing large projects of single and multi-floor buildings.
Process Flowchart


 Scatter Diagrams
The Scatter Diagrams solution extends ConceptDraw PRO v10 functionality with templates, samples, and a library of vector stencils that make construction of a Scatter Plot easy. The Scatter Chart Solution makes it easy to design attractive Scatter Diagrams used in various fields of science, work, and life activities. ConceptDraw PRO lets you enter the data to the table and construct the Scatter Plot Graph automatically according to these data.
Cross-Functional Flowchart (Swim Lanes)

 Presentation Clipart
Presentation design elements solution extends ConceptDraw PRO software with slide samples, templates and vector stencils libraries with design elements of presentation symbols, arrows, callouts, backgrounds, borders and frames, title blocks.
 Directional Maps
Directional Maps solution extends ConceptDraw PRO software with templates, samples and libraries of vector stencils for drawing the directional, location, site, transit, road and route maps, plans and schemes.
Basic Flowchart Symbols and Meaning


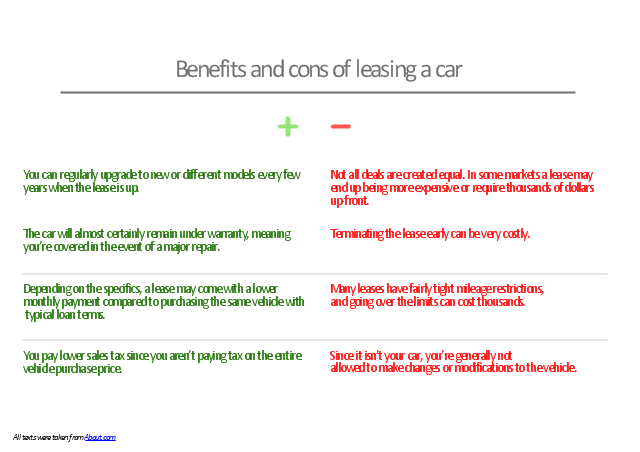
"Vehicle leasing is the leasing (or the use of) a motor vehicle for a fixed period of time at an agreed amount of money for the lease. It is commonly offered by dealers as an alternative to vehicle purchase but is widely used by businesses as a method of acquiring (or having the use of) vehicles for business, without the usually needed cash outlay. The key difference in a lease is that after the primary term (usually 2,3 or 4 years) the vehicle has to be returned to the leasing company for disposal." [Vehicle leasing. Wikipedia]
The presentation slide example "Benefits and cons of car leasing" was created in the ConceptDraw PRO diagramming and vector drawing software using the Presentation Clipart solution from the Illustration area of ConceptDraw Solution Park.
The presentation slide example "Benefits and cons of car leasing" was created in the ConceptDraw PRO diagramming and vector drawing software using the Presentation Clipart solution from the Illustration area of ConceptDraw Solution Park.
Presentation slide
- Automated Car Parking System Use Case Diagram
- Car Park Drawing Tool
- Draw Landscape Of Car Parking
- Deployment Diagram For Automatic Car Parking
- Car Park Symbol In Landscape Design
- Sport Field Plans | Building Plans Area | Dfd Of Car Parking
- Use Case Diagram For Car Parking System
- Fishbone Diagram | Process Flowchart | Car Parking Causes ...
- Sample Parking Lot Control
- Benefits and cons of car leasing - Presentation slide | Presentation ...
- Sequence Diagram For Car Parking System
- Draw The Landscape Design Of Car Parking Site
- Activity Diagram For Car Parking System
- Use Case For Parking Managment System
- Use Case Diagram For Automatic Car Parking System
- UML Diagram of Parking | UML Sequence Diagram Example . SVG ...
- Secure parking | Secure parking | Site Plan Software | Secure Parking
- Parking Management Dfd
- Class Diagram For Car Parking System