Basic Flowchart Symbols and Meaning


Pie Chart Examples and Templates

Pie chart examples and templates created using ConceptDraw DIAGRAM software helps you get closer with pie charts and find pie chart examples suite your needs.
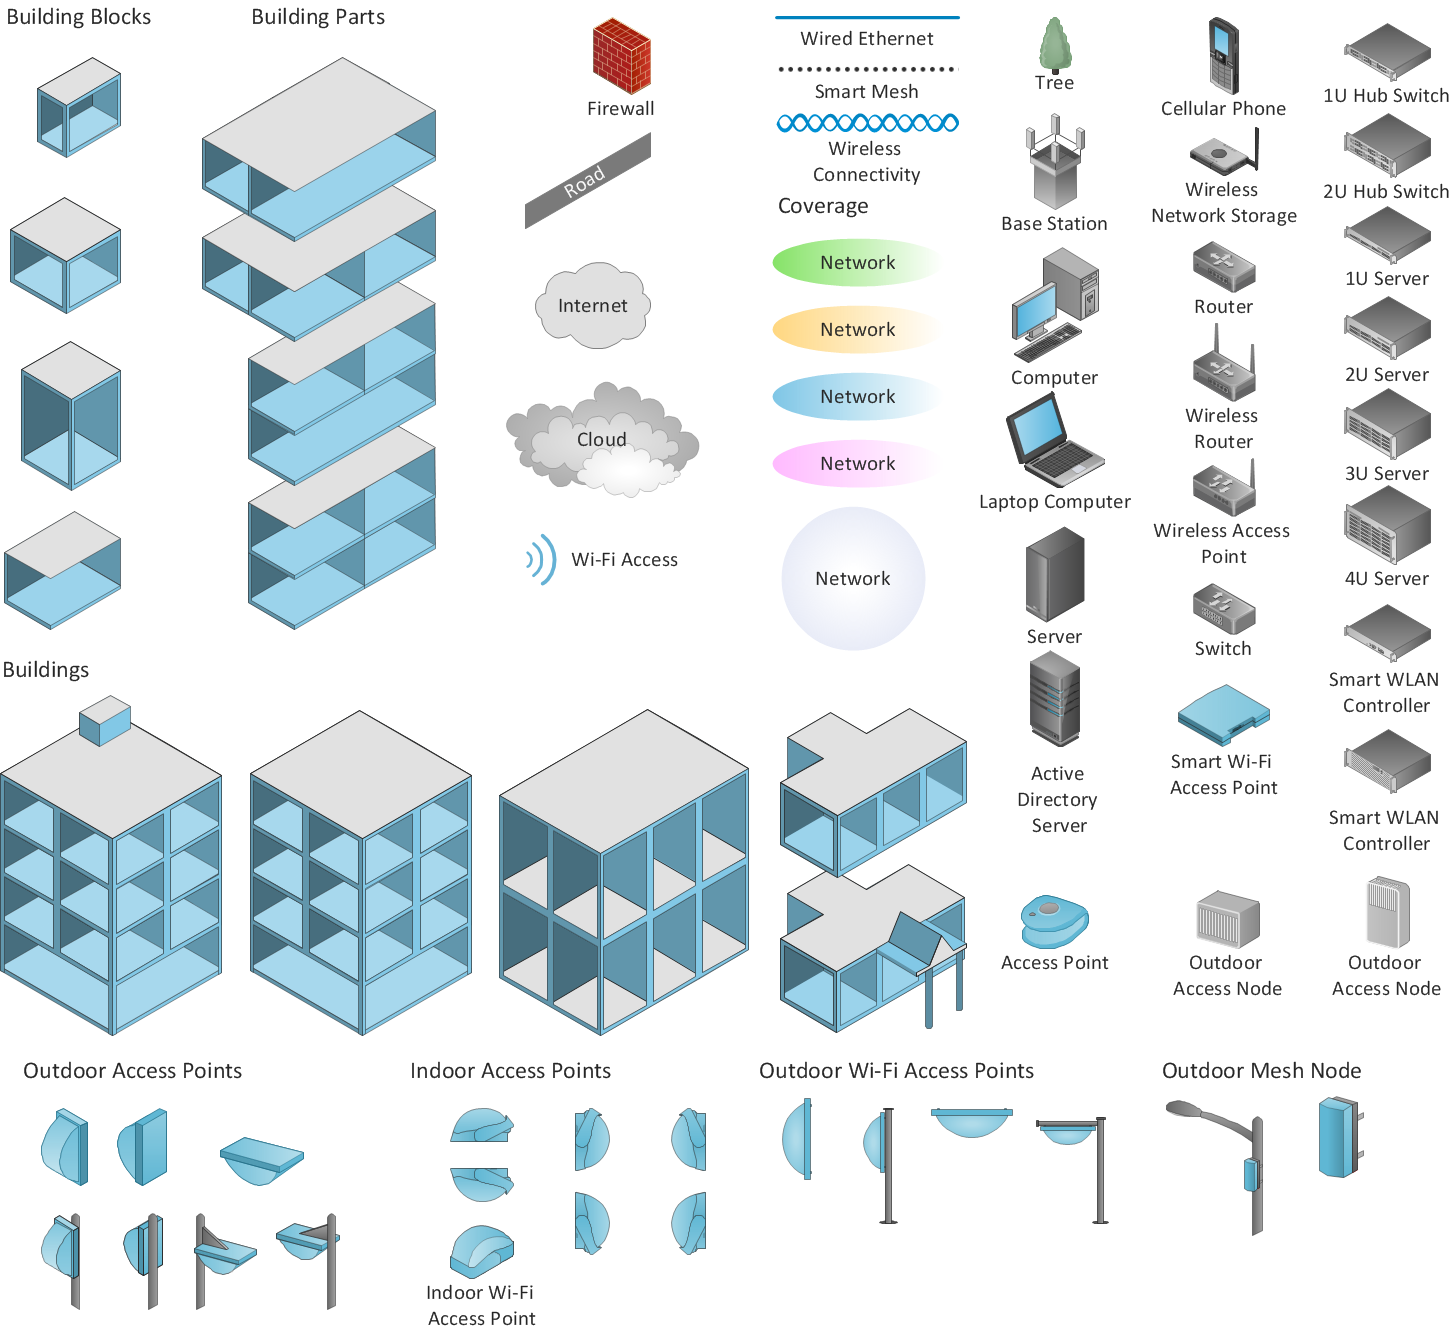
Wireless Network Diagram Examples
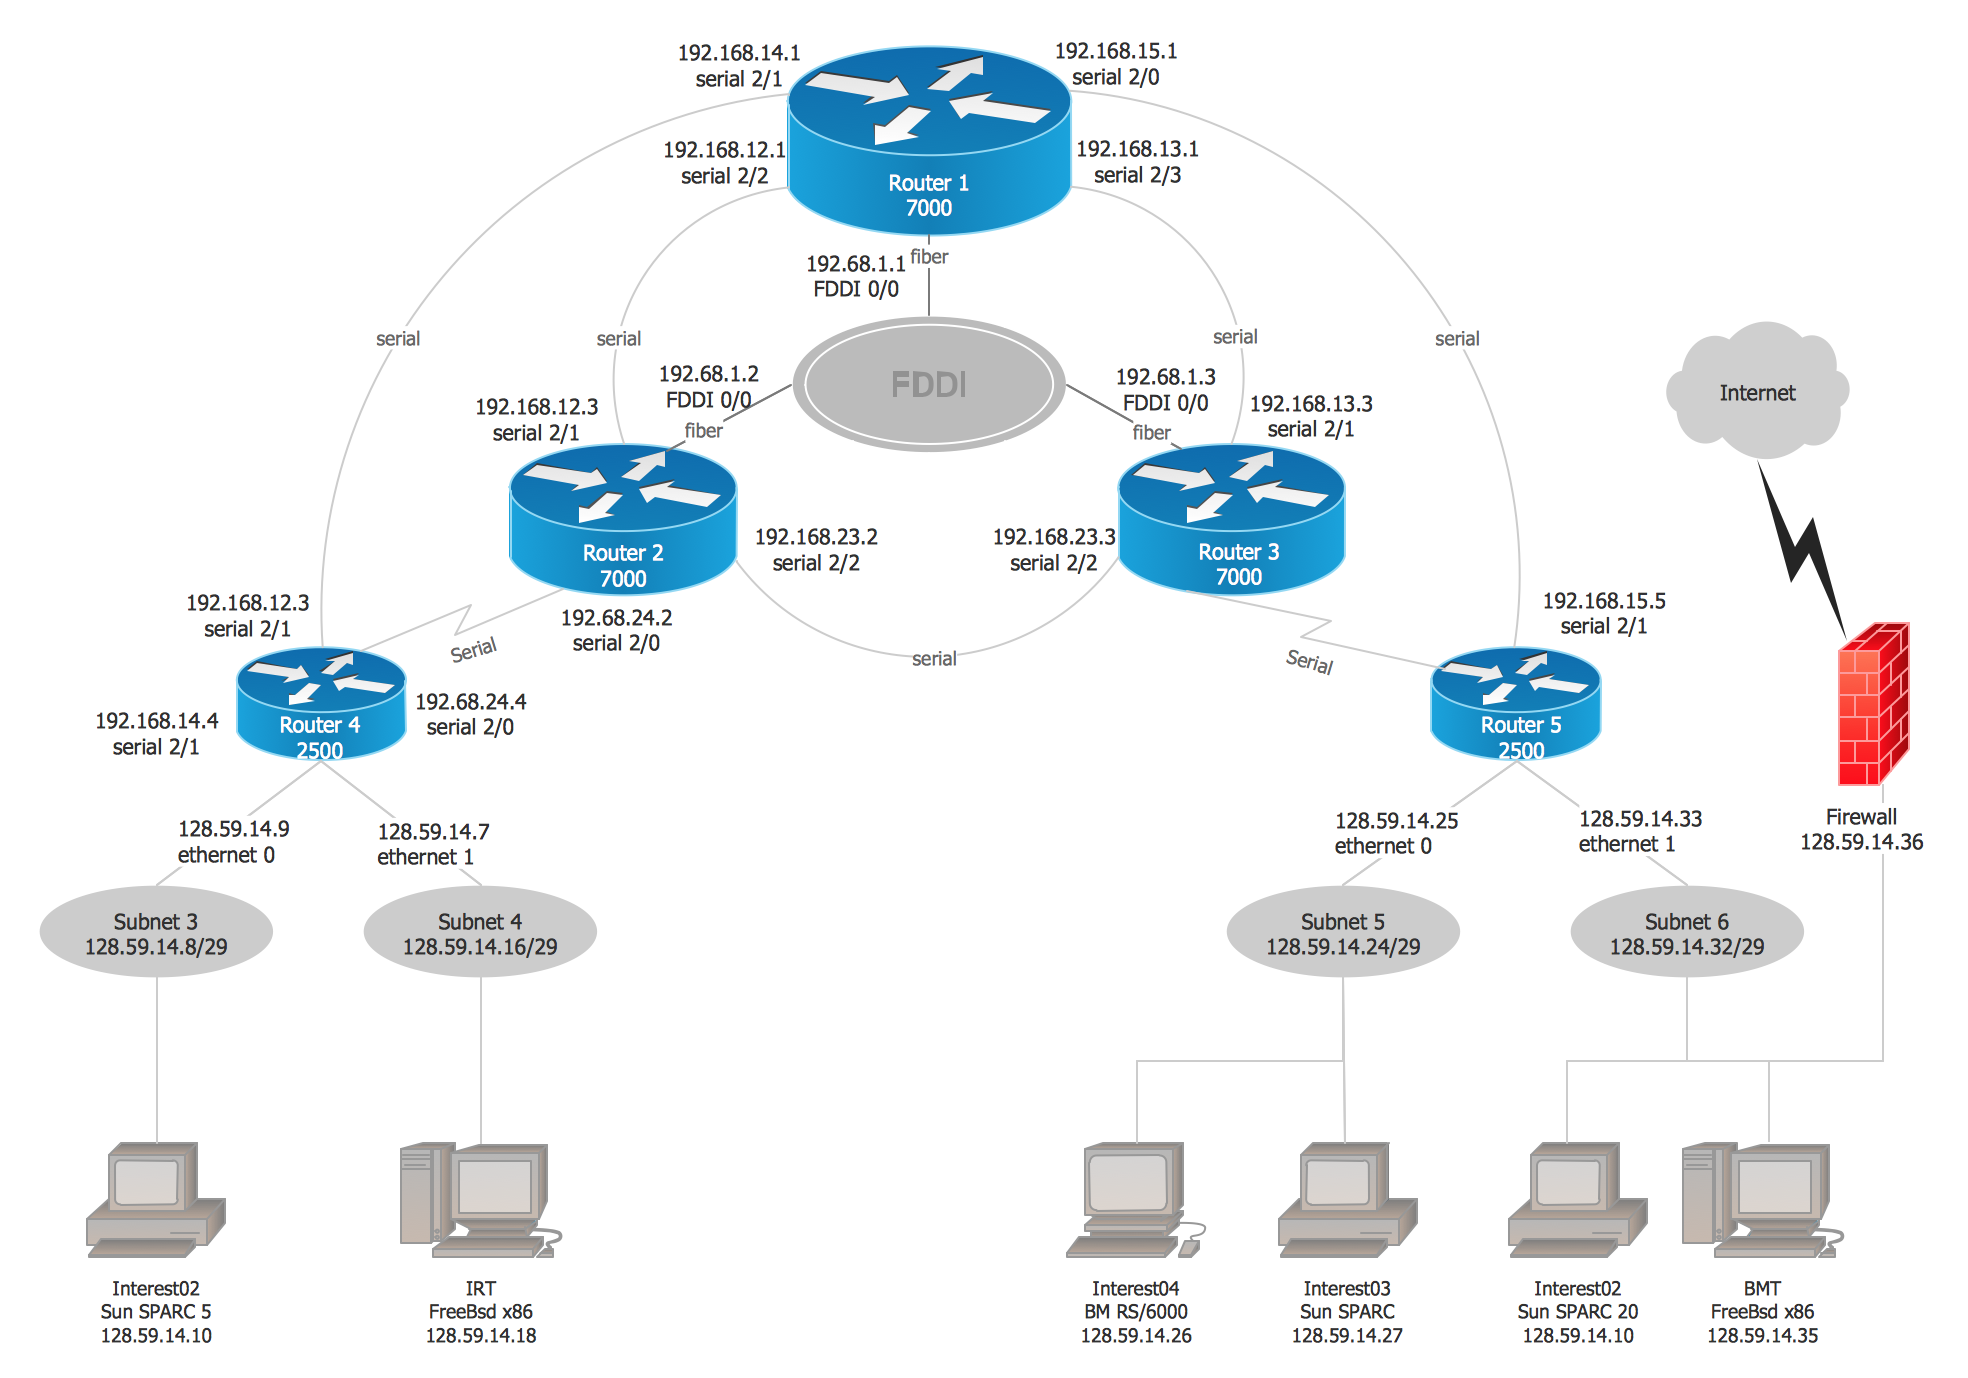
Cisco Network Examples and Templates
Swot Analysis Examples

Storage area networks (SAN). Computer and Network Examples
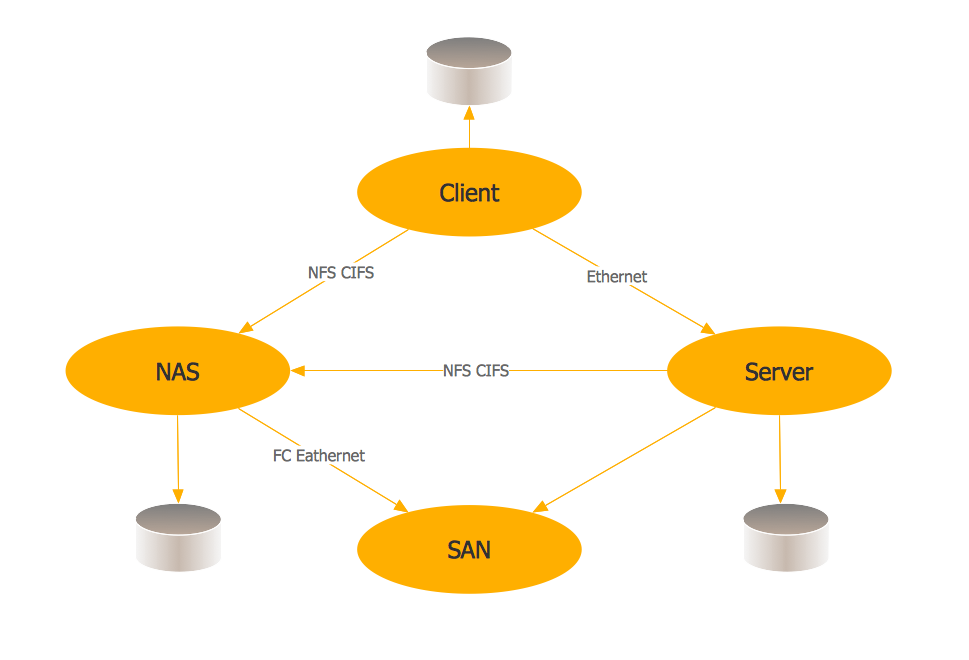
This example was created in ConceptDraw DIAGRAM using the Computer and Networks Area of ConceptDraw Solution Park. It shows the hybrid of Storage area network (SAN) and Network Attached Storage (NAS) technologies.

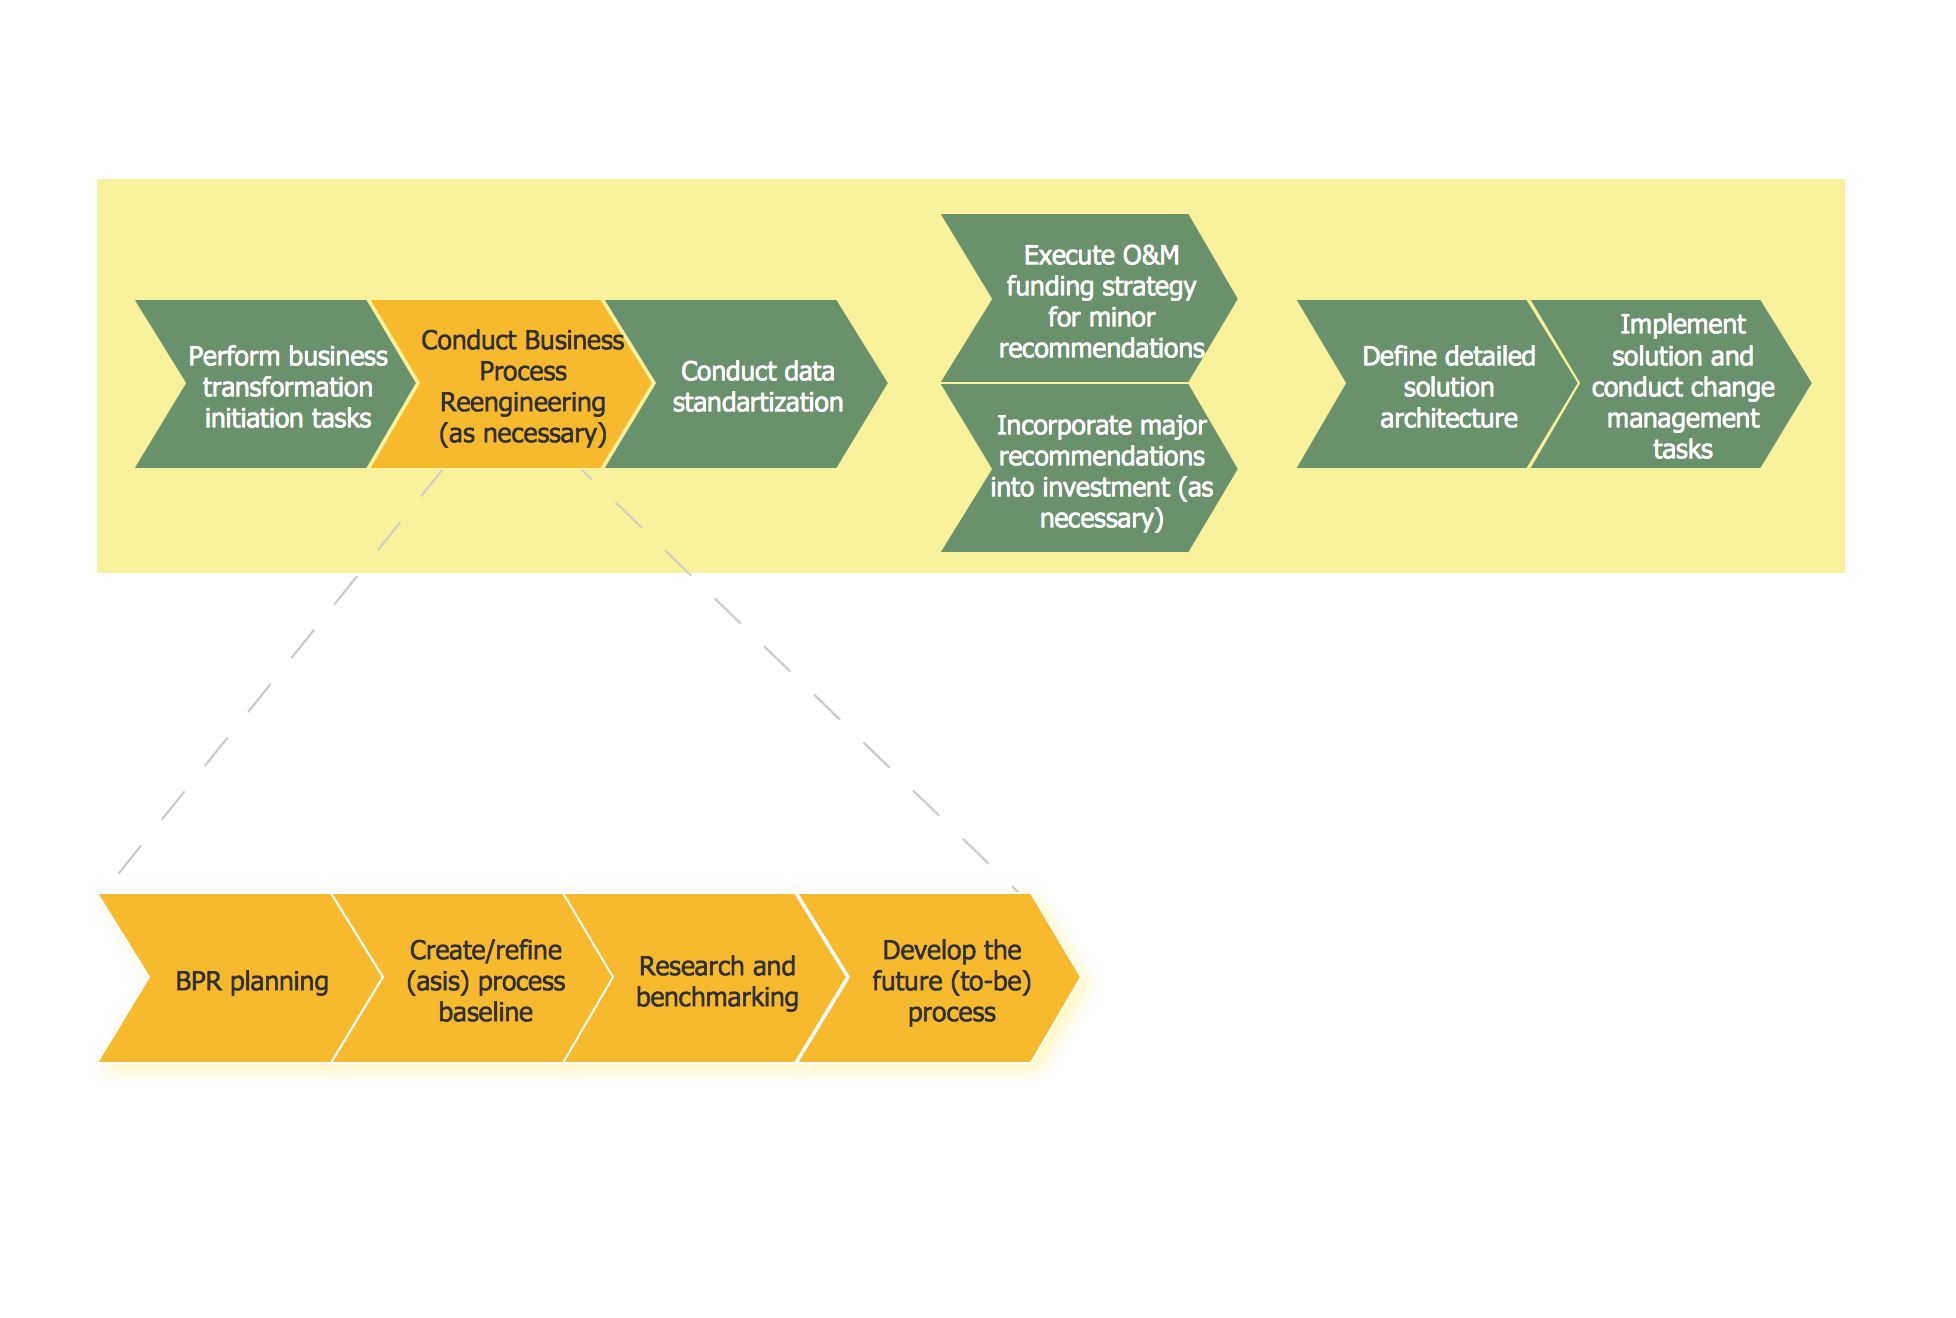
Business Process Reengineering Examples
Business Report Pie. Pie Chart Examples

 Business and Finance
Use Business and Finance solution to make professional-looking documents, presentations and websites, business, finance, advertising, and project management illustrations, or any designs that requires clipart of currency, office, business, advertising, management, marketing, people, time, post, contacts, collaboration, etc.
Business Process Workflow Diagram

The workflows on the Business Process Workflow Diagram are represented using the set of common symbols which let easy illustrate business processes and process flows, depict the start, all major steps and end of the process, what data are used by the process, how the data flow through the business areas within scope of our project, how the tasks are executed and by who, and how workers interact with each other.

- Business Needs Template Examples
- Examples Of Business Needs Software
- Network Diagram Examples | How to Draw a Computer Network ...
- Fundraising Pyramid | Pyramid Chart Examples | Process Flowchart ...
- Marketing Organization Chart | Marketing and Sales Organization ...
- Example Of Affinity Diagram Business Requirements
- Computer Network Architecture. Computer and Network Examples ...
- Best Value — Total Quality Management | Pie Chart Examples and ...
- Business Calendar | Business calendar example | How to Create ...
- Network Diagram For Small Business
- ERD | Entity Relationship Diagrams, ERD Software for Mac and Win
- Flowchart | Basic Flowchart Symbols and Meaning
- Flowchart | Flowchart Design - Symbols, Shapes, Stencils and Icons
- Flowchart | Flow Chart Symbols
- Electrical | Electrical Drawing - Wiring and Circuits Schematics
- Flowchart | Common Flowchart Symbols
- Flowchart | Common Flowchart Symbols