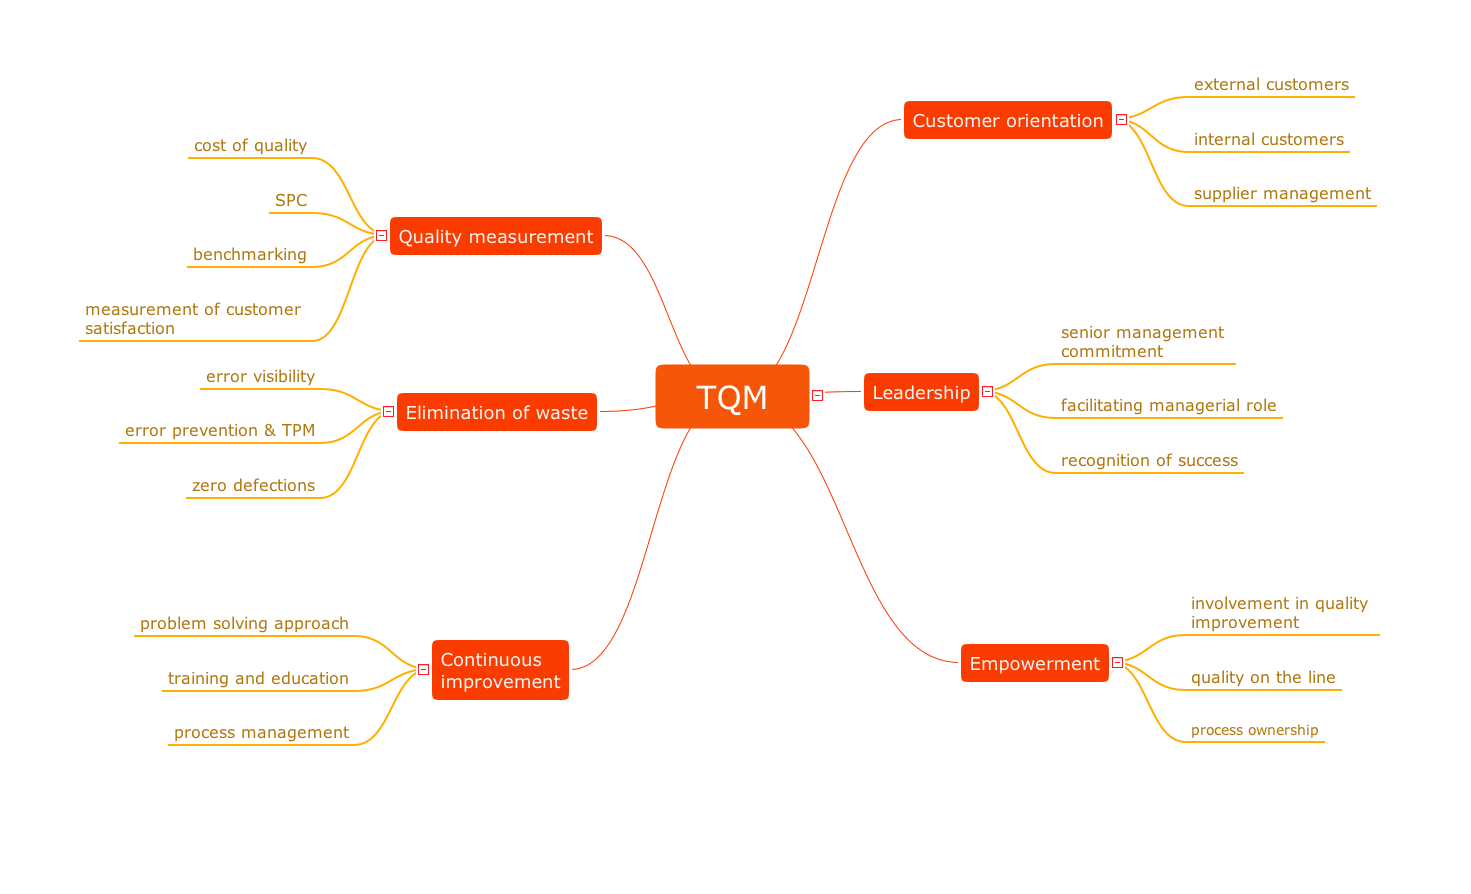
TQM Diagram Tool
The Total Quality Management Diagram solution helps you and your organization visualize business and industrial processes. Create Total Quality Management diagrams for business process with ConceptDraw software.Total Quality Management Business Diagram
The Total Quality Management Diagram solution helps you and your organization visualize business and industrial processes. Create Total Quality Management diagrams for business process with ConceptDraw software.Cause and Effect Analysis - Fishbone Diagrams for Problem Solving
Fishbone diagram is a powerful tool used for solving business problems and obstacles. ConceptDraw PRO software extended with Fishbone Diagrams solution from the Management area of ConceptDraw Solution Park is a helpful tool for cause and effect analysis. It gives the ability to easy identify many possible causes and factors which cause the effects and to draw Fishbone Diagrams for problem solving.
 Seven Basic Tools of Quality
Manage quality control in the workplace, using fishbone diagrams, flowcharts, Pareto charts and histograms, provided by the Seven Basic Tools of Quality solution.
Types of Flowcharts
A Flowchart is a graphical representation of process, algorithm, workflow or step-by-step solution of the problem. It shows the steps as boxes of various kinds and connects them by arrows in a defined order depicting a flow. There are twelve main Flowchart types: Basic Flowchart, Business Process Modeling Diagram (BPMN), Cross Functional Flowchart, Data Flow Diagram (DFD), IDEF (Integrated DEFinition) Flowchart, Event-driven Process Chain (EPC) Diagram, Influence Diagram (ID), Swimlane Flowchart, Process Flow Diagram (PFD), Specification and Description Language (SDL) Diagram, Value Stream Mapping, Workflow Diagram. Using the Flowcharts solution from the Diagrams area of ConceptDraw Solution Park you can easy and quickly design a Flowchart of any of these types. This solution offers a lot of special predesigned vector symbols for each of these widely used notations. They will make the drawing process of Flowcharts much easier than ever. Pay also attention for the included collection of ready Flowchart examples, samples and quick-start templates. This is business process improvement tools. If you are looking for MS Visio for your Mac, then you are out of luck, because it hasn't been released yet. However, you can use Visio alternatives that can successfully replace its functions. ConceptDraw PRO is an alternative to MS Visio for Mac that provides powerful features and intuitive user interface for the same.
TQM Diagram — Professional Total Quality Management
The Total Quality Management Diagram solution helps you and your organization visualize business and industrial processes. Create Total Quality Management diagrams for business process with ConceptDraw software.Value-Stream Mapping for Manufacturing
Create value stream maps - for value stream analysis and value stream management, material and information flow mapping, using our quick start templates included with ConceptDraw.
 Fishbone Diagram
Fishbone Diagrams solution extends ConceptDraw PRO software with templates, samples and library of vector stencils for drawing the Ishikawa diagrams for cause and effect analysis.
TQM Tools
ConceptDraw PRO diagramming and vector drawing software enhanced with Total Quality Management (TQM) Diagrams solution from the Quality area of ConceptDraw Solution Park is rich for the useful and effective TQM tools.Quality Improvement
Constant improvement of key performance indicators that are related to quality is a step in the right direction for a company interested in market growth.Quality Management Teams
ConceptDraw MINDMAP with Quality mindmaps solution as a demonstration of the creative approach to quality management in daily work of quality management team.Quality Control
Using mind mapping for quality management is a creative approach that allows one to structure all key quality points on the one page.- Swim Lane Diagrams | Types of Flowcharts | Total Quality ...
- PROBLEM ANALYSIS. Root Cause Analysis Tree Diagram | Cause ...
- Cause and Effect Analysis - Fishbone Diagrams for Problem Solving ...
- PROBLEM ANALYSIS. Root Cause Analysis Tree Diagram ...
- Total Quality Management with ConceptDraw | TQM Diagram Tool ...
- Process Flowchart | Root cause analysis tree diagram - Sale ...
- Cause And Effect Diagram Example For Type Of Defects
- Probability Quality Control Tools | TQM Diagram Example | TQM ...
- Cause And Effect Tools
- Root cause analysis tree diagram - Template | How To Create Root ...
- How Do Fishbone Diagrams Solve Manufacturing Problems | Cause ...
- About Cause Of Defect Diagram
- Cause and effect diagram - Increase in productivity | Total Quality ...
- PROBLEM ANALYSIS. Root Cause Analysis Tree Diagram | Root ...
- Total Quality Management with ConceptDraw | ConceptDraw ...
- Root cause analysis tree diagram - Personal problem solution ...
- Fishbone Diagram For Defective Products
- Fishbone diagram - Causes of low-quality output | Design elements ...
- Process Flowchart | Fishbone Diagram | Fishbone Diagrams ...
- Seven Management and Planning Tools | Marketing Diagrams ...


