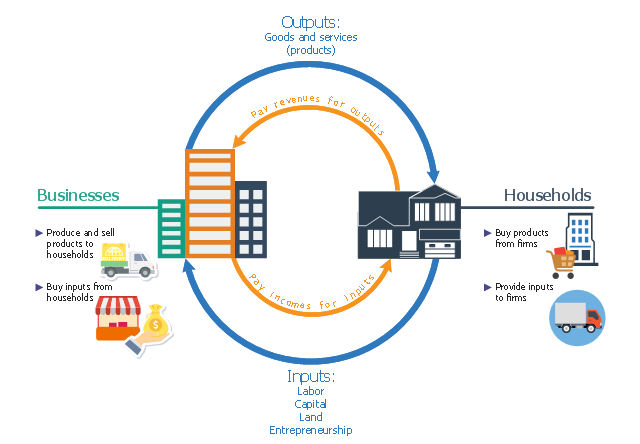
This business infographic sample shows the circular flow of inputs and outputs between businesses and households. It was designed on the base of the Wikimedia Commons file: Fundamentals of Business - Fig. 2.1 - Circular flow of inputs and outputs.jpg. [commons.wikimedia.org/ wiki/ File:Figure_ 2.1_ Circular_ flow_ of_ inputs_ and_ outputs.jpg]
This file is licensed under the Creative Commons Attribution 4.0 International license. [creativecommons.org/ licenses/ by/ 4.0/ deed.en]
"Many of the factors of production (or resources) are provided to businesses by households. For example, households provide businesses with labor (as workers), land and buildings (as landlords), and capital (as investors). In turn, businesses pay households for these resources by providing them with income, such as wages, rent, and interest. The resources obtained from households are then used by businesses to produce goods and services, which are sold to the same households that provide businesses with revenue. The revenue obtained by businesses is then used to buy additional resources, and the cycle continues." [saylor.org/ site/ textbooks/ Exploring%20 Business.pdf]
The business infographic example "Circular flow of inputs and outputs" was designed using ConceptDraw PRO diagramming and vector drawing software extended with the Business and Finance solution from Illustration area of ConceptDraw Solution Park.
Infographic
Basic Flowchart Symbols and Meaning


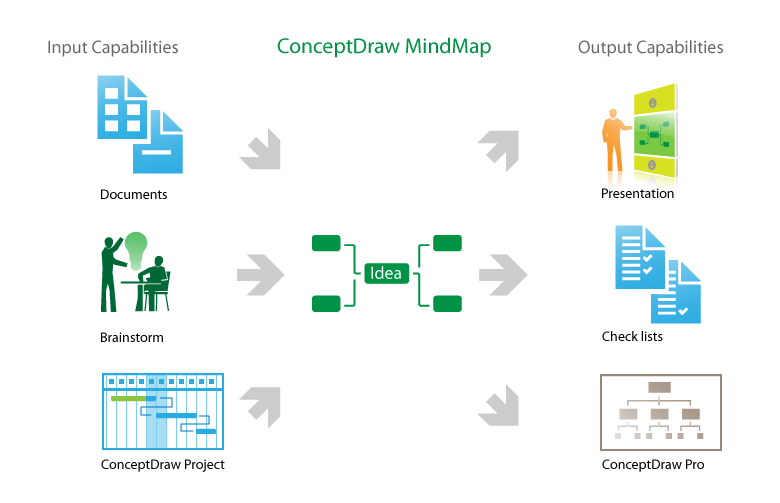
How to make great presentation via Skype? ...how it works with ConceptDraw MINDMAP?

 Business Process Mapping
The Business Process Mapping solution for ConceptDraw DIAGRAM is for users involved in process mapping and creating SIPOC diagrams.
Business Process Flowchart Symbols

Data Flow Diagram Symbols. DFD Library

Swim Lane Diagrams

How to do presentation of Mind Maps via Skype conference call?
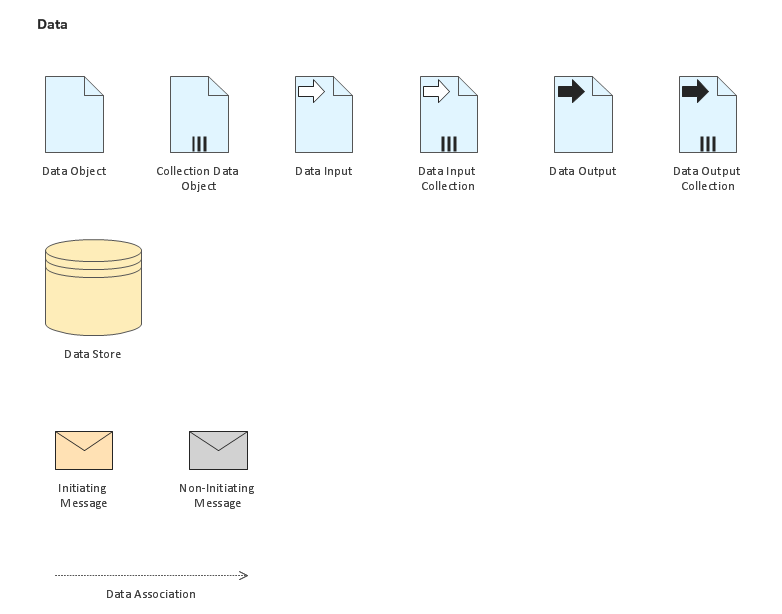
Business Process Elements: Data

HelpDesk
Event-driven Process Chain (EPC) Diagram Software

- Example Of Flowchart That Has Input Process Output And Discussion
- Input Process Output Diagram Example
- Business Input And Output Diagram
- Input Output Process Diagrame
- Input Output Chart Process Flow
- How To Show Input And Output In Flowchart
- Example Input And Output Flowchart
- Business Process Mapping | IDEF0 Diagrams | Input Process Output ...
- In A Flowchart An Input Or Output Instruction Is Represented By
- Symbol Input Output