Sample Pictorial Chart. Sample Infographics
Sample Pictorial Chart - Pictorial Infographics solution provides easy-to-use design infographics drawing tools, large collection of different sample infographics and infograms, sample pictorial chart and templates to be filled in, and 10 libraries with great quantity of predesigned vector pictograms. Use Pictorial Infographics solution to draw your own design pictorial infographics documents quick and easy.Design Pictorial Infographics. Design Infographics
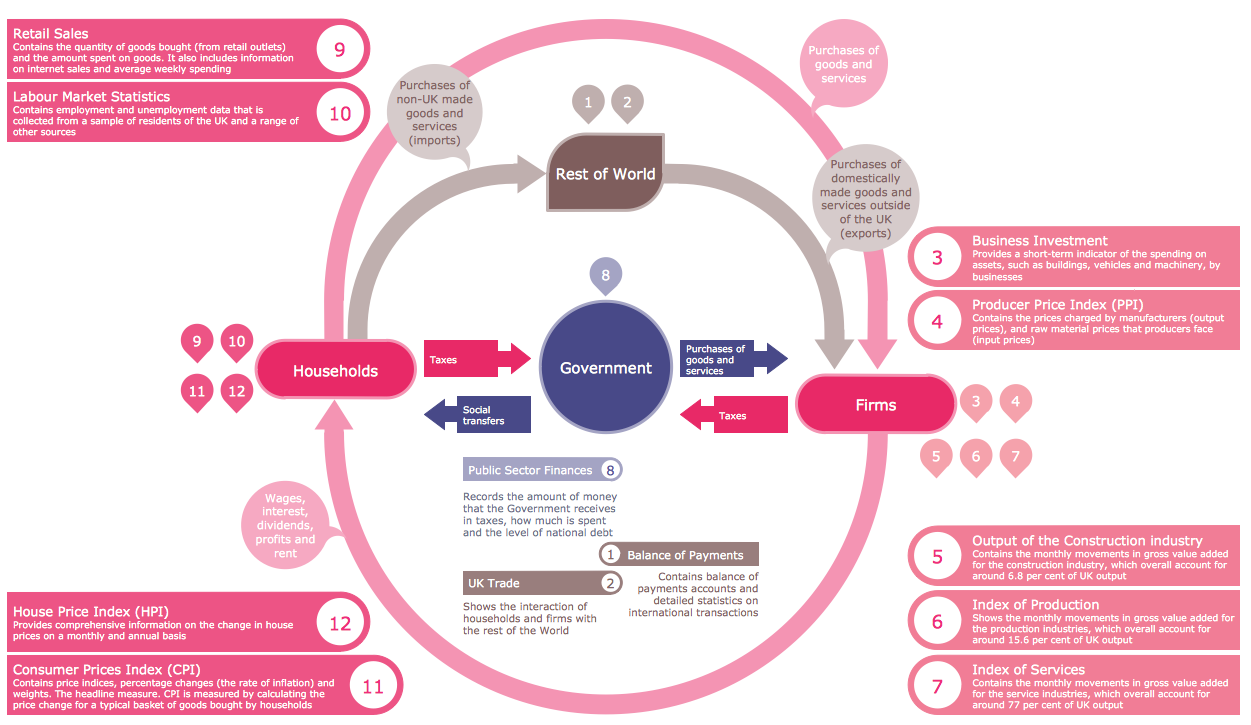
In the course of recent decades data visualization went through significant development and has become an indispensable tool of journalism, business intelligence and science. The way visual information may be conveyed is not limited simply to static or dynamic representation, it can also be interactive. Infographics can be conditionally divided into several general levels. Primarily, this is level of visualization of information, its interpretation and association on any ground. Second level can be defined as a visualization of knowledge, depiction of thoughts and ideas in the form of images or diagrams. Finally, the level of data visualization, which processes data arrays in charts, enabling the information to be more clearly perceived. You can also identify the main approaches to the creation of infographics: exploratory and narrative. Exploratory method insists on minimalist design in favor of data precision without unnecessary details and is common for scientific researches and anaInfographic Generator
ConceptDraw PRO extended with Typography Infographics Solution from the “What are Infographics” Area is the best Infographic Generator. Make sure in it right now! Typography Infographics Solution offers you the best numerous collection of predesigned infographics examples and 9 libraries with large quantity of ready-to-use vector stencils that will help you design your own Typography Infographics of any complexity in minutes..Excellent Examples of Infographic Maps
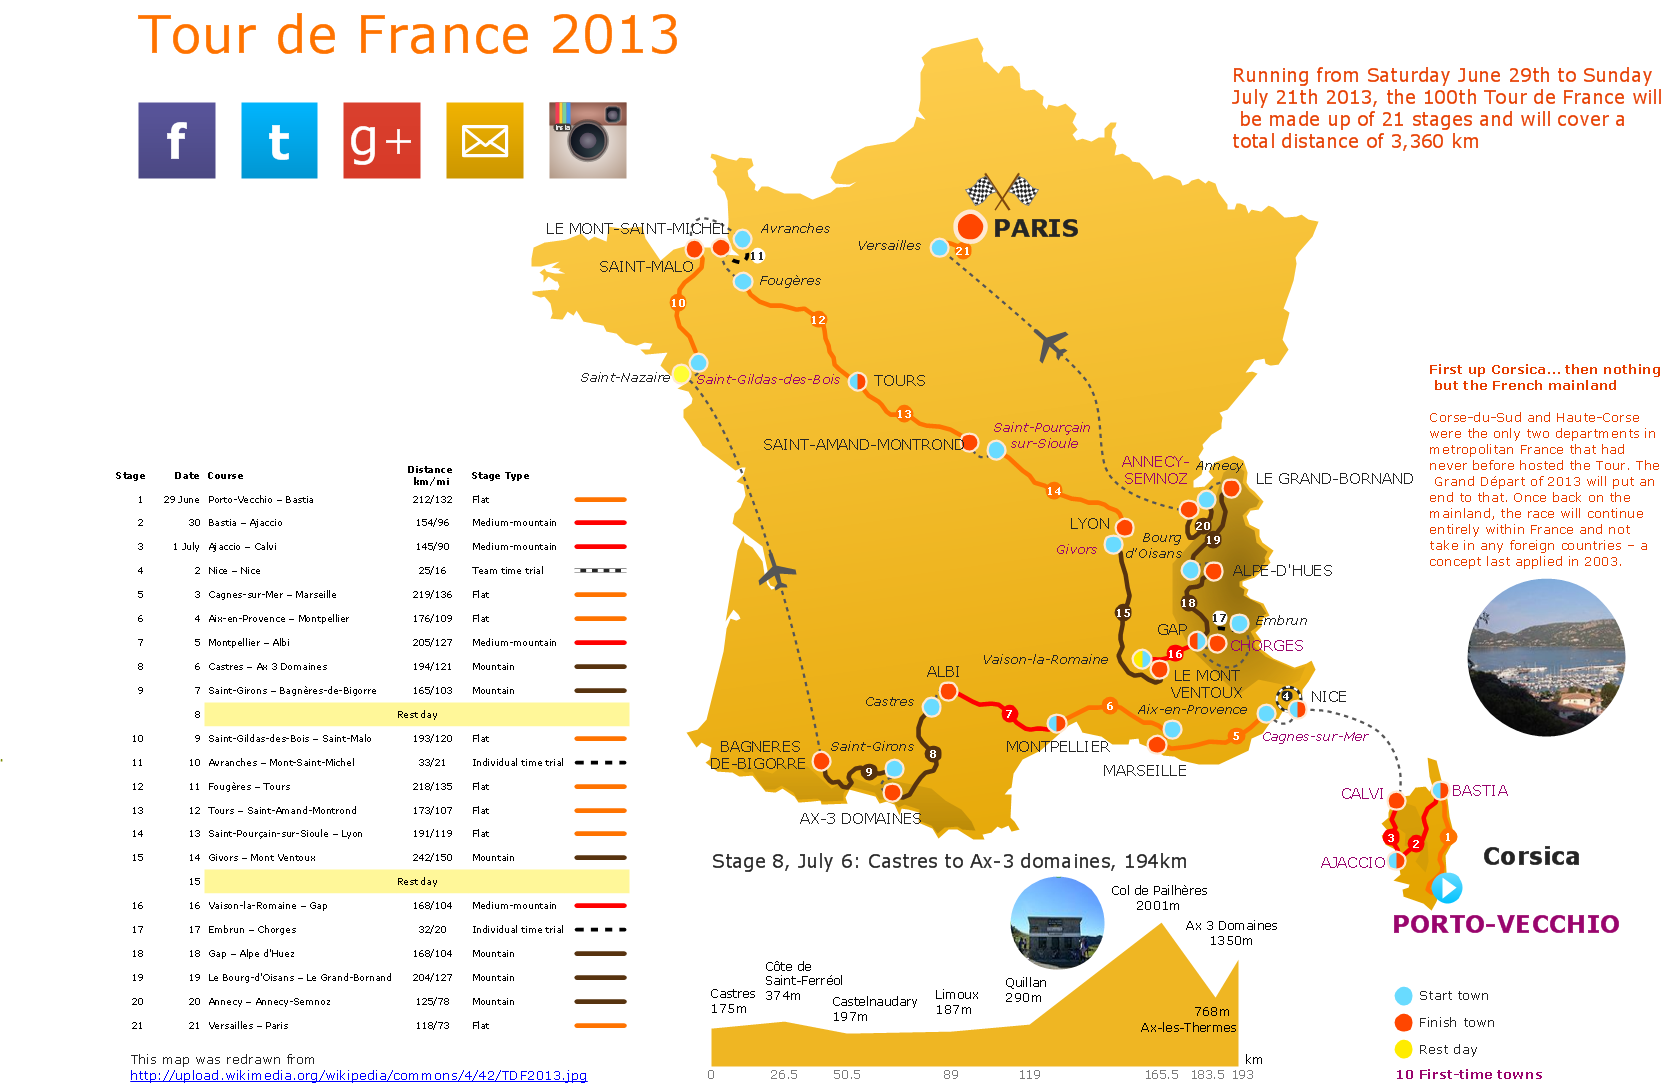
Create Spatial infographics with ConceptDraw using its excellent examples of infographic maps. We hope these can inspire and teach you!Spatial infographics Design Elements: Location Map
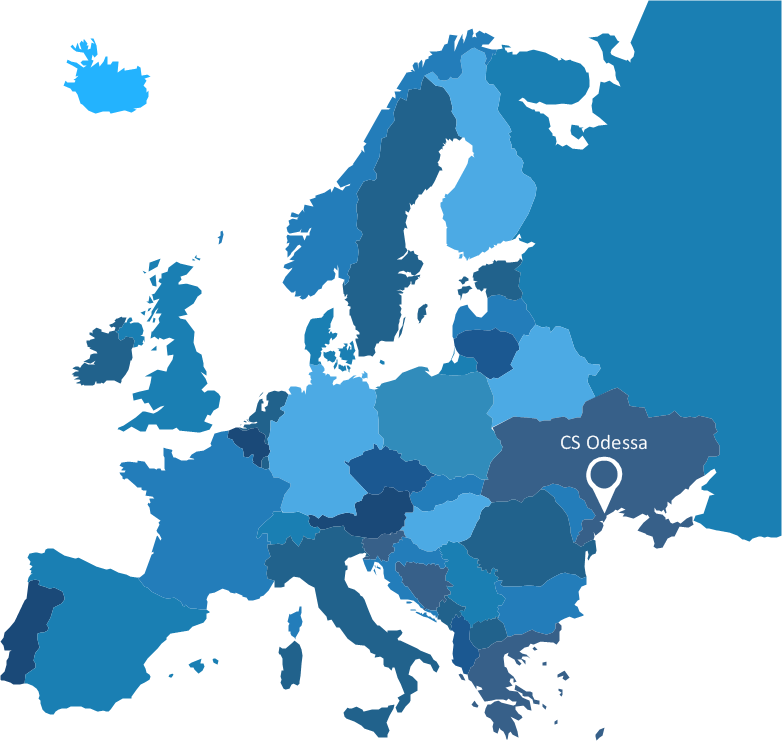
Infographic Design Elements for visually present various geographically distributed information.Typography Infographic Examples
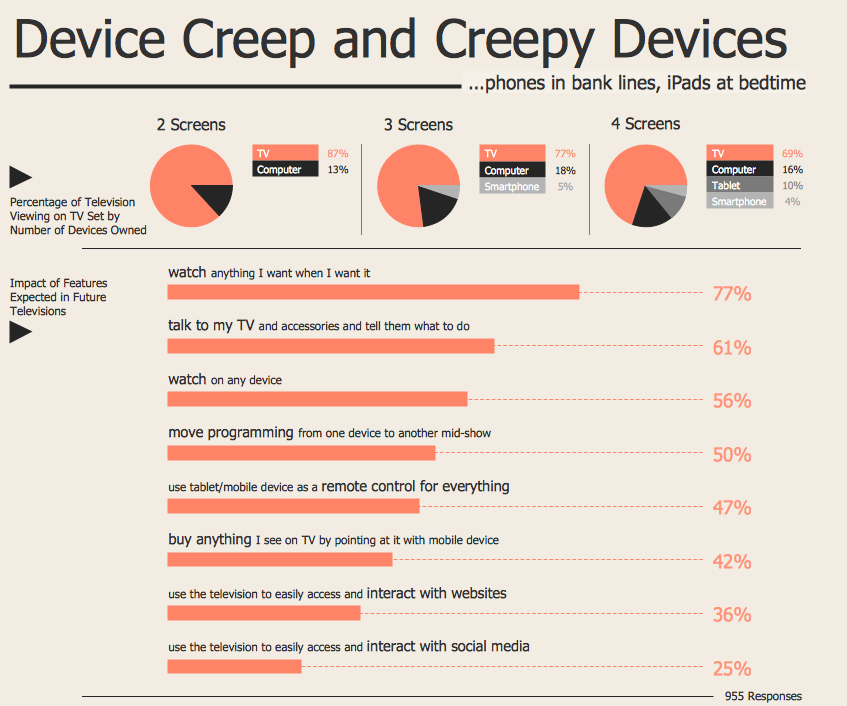
ConceptDraw PRO extended with Typography Infographics Solution from the “What are Infographics” Area is a powerful infographic software that offers you variety of infographics examples. Use of predesigned examples as the base for your own Typography Infographics is a timesaving and useful way. Simply open the desired example, change for your needs and then successfully use it in any field of your activity.Best Tool for Infographic Construction
ConceptDraw is a best data visualization tool that will allow everyone to create rich infographics and visualizations quickly and easily.Superb Examples of Infographic Maps
Great examples of Infographic Maps, they are needed for inspiration.Infographic Maker
Infographic is a visual way of representing various information, data, knowledge in statistics, geography, journalism, education, and much more areas. ConceptDraw PRO supplied with Pictorial Infographics Solution from the “What are Infographics” Area, provides a set of powerful pictorial infographics tools. Thanks to them it is the best Infographic Maker.Visualization Spatial Data Using Thematic Maps Combined with Infographics
Now anyone can build an infographics from their data using ConceptDraw. Nice and simple, but the features it have are power-packed!
 Computers and Communications
Computers and communications solution extends ConceptDraw PRO software with illustration samples, templates and vector stencils libraries with clip art of computers, control devices, communications, technology, Apple machines.
Winter Sports Vector Clipart. Medal Map. Spatial Infographics
Tracking Olympic results in visual format is the most modern way to deliver statistics to a broad audience. This is a good example of an illustrated table you may easily modify, print, or publish on web from ConceptDraw Winter Sports solution .Internet Marketing Infographic
ConceptDraw PRO extended with Marketing Infographics Solution from the Business Infographics Area is the best software for creating Internet Marketing Infographic of any complexity in minutes. Make sure in it right now!- Gesture In Business Communication
- Computers and Communications | How to Create Computers and ...
- Business Communication Clipart Png
- Images Of Transport And Communication
- Process Flowchart | How to Create a Powerful Infographic When ...
- Computers and Communications | Basic Flowchart Images ...
- Management Communication Clip Art
- Business People Clipart | Post and Mail - Design Elements ...
- Computers and Communications | Illustration | Business People ...
- Business People Clipart | Illustration | Project management - Design ...
- Flowchart Of Business Communication In Organization
- Sample Pictorial Chart. Sample Infographics | How to Draw Pictorial ...
- Design Pictorial Infographics . Design Infographics | How to Draw a ...
- Sample Pictorial Chart. Sample Infographics | Design elements ...
- Business Process Model and Notation | Marketing Infographics ...
- Diagram For Organisational Chart As In Business Communication
- Effective Business Communication For Draw On Chart
- Chart For Business Communication
- Business Communication Chart
- Diagram On Business Communication


