UML Block Diagram
Use Case Diagram Taxi Service UML. This sample was created in ConceptDraw PRO diagramming and vector drawing software using the UML Use Case Diagram library of the Rapid UML Solution from the Software Development area of ConceptDraw Solution Park. This sample shows the work of the taxi service and is used by taxi stations, by airports, in the tourism field and delivery service.The Building Blocks Used in EPC Diagrams
Event-Driven Process Chain Diagrams is using for improvement throughout an organisation. ConceptDraw PRO - software that reduces the time needed to create a EPC diagrams.HelpDesk
How to Add a Block Diagram to a MS Word ™ Document Using ConceptDraw PRO
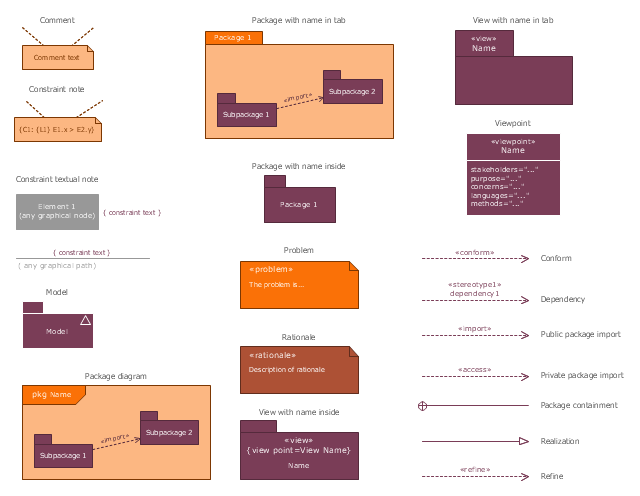
Block diagram consists from graphic blocks. Blocks are connected by lines or arrows. Block diagrams are used to show the relationship between parts of some systems. It can be used for the development of new systems or to improve existing ones. The structure of block diagram gives a high-level overview of the major components of the system, as well as the important relationships. Using the block diagrams, you can more effectively present the business data contained in your MS Word documents. ConceptDraw PRO allows you to easily create block diagrams and then insert them into a MS Word document.About UML
Use Case Diagram Taxi Service UML. This sample was created in ConceptDraw PRO diagramming and vector drawing software using the UML Use Case Diagram library of the Rapid UML Solution from the Software Development area of ConceptDraw Solution Park. This sample shows the work of the taxi service and is used by taxi stations, by airports, in the tourism field and delivery service.Basic Diagramming
Block diagrams are essentially a very simple format of diagrams. A variety of commonly used shapes and connecting lines, rules of construction and actions pertaining to them, make Block diagram a versatile and flexible tool for many forms of industry. Another advantage is the ease with which Block diagrams can be constructed, especially if you use professional diagramming software. ConceptDraw PRO software is an example of purpose built application designed with the form of process modeling in mind. It includes Block Diagrams solution from Diagrams area of ConceptDraw Solution Park for easy drawing professional-looking simple diagram - Block diagram, and a lot of other useful solutions for designing variety of other types of diagrams, schematics and flowcharts (Line graphs, Bar charts, Organizational charts, Histograms, Pie charts, Process flowcharts, Fault tree analysis diagrams, Scatter plots, Venn diagrams, Bubble diagrams, etc.). The RapidDraw functionality of ConceptDraw PRO lets create new objects and their connectors in just single-click.
Basic Diagramming
Mathematics is an exact science, which studies the values, spatial forms and quantitative relations. It is a science, in which is built large number of various diagrams, charts and graphs that present the material in a clear, visual and colorful form, help to analyze the information and to make certain conclusions. A diagram is a graphical representation of data using the linear segments or geometric shapes, which allows to evaluate the ratio of several values. Depending on the types of solved tasks are used the diagrams of different kinds. A graph is a diagram that shows quantitative dependencies of various processes using the curves. ConceptDraw PRO is a powerful intelligent and multifunctional vector engine for drawing different Mathematical diagrams and graphs, Mathematical illustrations, complex and simple Diagram mathematics, Flowcharts of equation solving process, Line graphs, Scatter plots, Histograms, Block diagrams, Bar charts, Divided bar diagrams, Pie charts, Area charts, Circular arrows diagrams, Venn diagrams, Bubble diagrams, Concept maps, and many others.
Create Block Diagram
Block diagrams solution extends ConceptDraw PRO software with templates, samples and libraries of vector stencils for creating the block diagram. Create block diagrams, electrical circuit diagrams, schematics, and more in minutes with ConceptDraw PRO.Basic Diagramming
Create flowcharts, organizational charts, bar charts, line graphs, and more with ConceptDraw PRO.
Flow chart Example. Warehouse Flowchart
Warehouse Flowcharts are various diagrams that describe the warehousing and inventory management processes on the warehouses. Typical purposes of Warehouse Flowcharts are evaluating warehouse performance, measuring efficiency of customer service and organizational performance. This type of Workflow diagrams can be used for identifying any disconnection between business activities and business objectives. They are effectively used by warehouse-related people and organizations, manufacturers, wholesalers, exporters, importers, transporters, and others. Standard Warehousing process flow diagram and standard Workflow diagram are used for process identification for further evaluating effectiveness and profitability of overall business process. Use the ConceptDraw PRO vector graphic software extended with Flowcharts solution to design your own professional-looking Workflow diagrams and Flowcharts of any types, including the Warehouse flowchart, Process flow diagrams which depict in details all steps of Warehouse packages flow. Microsoft Visio, designed for Windows users, can’t be opened directly on Mac. But fortunately, there are several Visio alternatives for Mac which will help Mac users to work Visio files. With ConceptDraw PRO, you may open, edit and save files in Visio format.
Event-driven Process Chain Diagrams
Event-driven Process Chain (EPC) Diagram is a type of flowchart widely used for modeling in business engineering and reengineering, business process improvement, and analysis. EPC method was developed within the Architecture of Integrated Information Systems (ARIS) framework.
Basic Flowchart Symbols and Meaning
Flowcharts are the best for visually representation the business processes and the flow of a custom-order process through various departments within an organization. ConceptDraw PRO diagramming and vector drawing software extended with Flowcharts solution offers the full set of predesigned basic flowchart symbols which are gathered at two libraries: Flowchart and Flowcharts Rapid Draw. Among them are: process, terminator, decision, data, document, display, manual loop, and many other specific symbols. The meaning for each symbol offered by ConceptDraw gives the presentation about their proposed use in professional Flowcharts for business and technical processes, software algorithms, well-developed structures of web sites, Workflow diagrams, Process flow diagram and correlation in developing on-line instructional projects or business process system. Use of ready flow chart symbols in diagrams is incredibly useful - you need simply drag desired from the libraries to your document and arrange them in required order. There are a few serious alternatives to Visio for Mac, one of them is ConceptDraw PRO. It is one of the main contender with the most similar features and capabilities.
Process Flowchart
The main reason of using Process Flowchart or PFD is to show relations between major parts of the system. Process Flowcharts are used in process engineering and chemical industry where there is a requirement of depicting relationships between major components only and not include minor parts. Process Flowcharts for single unit or multiple units differ in their structure and implementation. ConceptDraw PRO is Professional business process mapping software for making Process flowcharts, Process flow diagram, Workflow diagram, flowcharts and technical illustrations for business documents and also comprehensive visio for mac application. Easier define and document basic work and data flows, financial, production and quality management processes to increase efficiency of your business with ConcepDraw PRO. Business process mapping software with Flowchart Maker ConceptDraw PRO includes extensive drawing tools, rich examples and templates, process flowchart symbols and shape libraries, smart connectors that allow you create the flowcharts of complex processes, process flow diagrams, procedures and information exchange. Process Flowchart Solution is project management workflow tools which is part ConceptDraw Project marketing project management software. Drawing charts, diagrams, and network layouts has long been the monopoly of Microsoft Visio, making Mac users to struggle when needing such visio alternative like visio for mac, it requires only to view features, make a minor edit to, or print a diagram or chart. Thankfully to MS Visio alternative like ConceptDraw PRO software, this is cross-platform charting and business process management tool, now visio alternative for making sort of visio diagram is not a problem anymore however many people still name it business process visio tools.
The vector stencils library "SysML diagrams" contains 19 symbols.
Use it to design your SysML diagrams using ConceptDraw PRO diagramming and vector drawing software.
"The Systems Modeling Language (SysML) is a general-purpose modeling language for systems engineering applications. It supports the specification, analysis, design, verification and validation of a broad range of systems and systems-of-systems.
SysML was originally developed by an open source specification project, and includes an open source license for distribution and use. SysML is defined as an extension of a subset of the Unified Modeling Language (UML) using UML's profile mechanism." [Systems Modeling Language. Wikipedia]
The building blocks example "Design elements - SysML diagrams" is included in the SysML solution from the Software Development area of ConceptDraw Solution Park.
Functional Block Diagram
You need design the Functional Block Diagram and dream to find the useful tools to draw it easier, quickly and effectively? ConceptDraw PRO offers the Block Diagrams Solution from the "Diagrams" Area which will help you!Elements of an Event-Driven Process Chain
Event-Driven Process chain Diagrams for improvement throughout an organisation. ConceptDraw PRO - software that reduces the time needed to create a business process model.- UML Block Diagram
- Block diagram - Planning process | Create Block Diagram | The ...
- Draw A Building Block Diagram
- UML Block Diagram | The Building Blocks Used in EPC Diagrams ...
- UML Block Diagram | About UML | The Building Blocks Used in EPC ...
- UML Block Diagram | The Building Blocks Used in EPC Diagrams ...
- HVAC Plans | Block diagram - Automotive HVAC system | How to ...
- UML Block Diagram | Office Layout Plans | The Building Blocks ...
- Chemistry | Diagram Of Building Block Of Periodic Table Of Element
- Create Block Diagram
- UML Block Diagram | About UML | The Building Blocks Used in EPC ...
- Block diagram - Automotive HVAC system | The Building Blocks ...
- Electrical Symbols, Electrical Diagram Symbols | Building Drawing ...
- Xml Building Block With Diagram
- UML Block Diagram | Cisco Buildings . Cisco icons, shapes, stencils ...
- The Building Blocks Used in EPC Diagrams | Bubble diagrams in ...
- The Building Blocks Used in EPC Diagrams | Basic Diagramming ...
- UML Block Diagram | About UML | The Building Blocks Used in EPC ...
- Block diagram - Automotive HVAC system | Cross Functional ...
- Collaboration Diagram And Its Building Blocks