HelpDesk
How to Create a Fault Tree Analysis Diagram (FTD) in ConceptDraw PRO
Fault Tree Diagram are logic diagram that shows the state of an entire system in a relationship of the conditions of its elements. Fault Tree Diagram are used to analyze the probability of functional system failures and safety accidents. ConceptDraw PRO allows you to create professional Fault Tree Diagrams using the basic FTD symbols. An FTD visualize a model of the processes within a system that can lead to the unlikely event. A fault tree diagrams are created using standard logic symbols . The basic elements in a fault tree diagram are gates and events.Context Diagram Template
This template shows the Context Diagram. It was created in ConceptDraw PRO diagramming and vector drawing software using the Block Diagrams Solution from the “Diagrams” area of ConceptDraw Solution Park. The context diagram graphically identifies the system. external factors, and relations between them. It’s a high level view of the system. The context diagrams are widely used in software engineering and systems engineering for designing the systems that process the information.
Process Flowchart
The main reason of using Process Flowchart or PFD is to show relations between major parts of the system. Process Flowcharts are used in process engineering and chemical industry where there is a requirement of depicting relationships between major components only and not include minor parts. Process Flowcharts for single unit or multiple units differ in their structure and implementation. ConceptDraw PRO is Professional business process mapping software for making Process flowcharts, Process flow diagram, Workflow diagram, flowcharts and technical illustrations for business documents and also comprehensive visio for mac application. Easier define and document basic work and data flows, financial, production and quality management processes to increase efficiency of your business with ConcepDraw PRO. Business process mapping software with Flowchart Maker ConceptDraw PRO includes extensive drawing tools, rich examples and templates, process flowchart symbols and shape libraries, smart connectors that allow you create the flowcharts of complex processes, process flow diagrams, procedures and information exchange. Process Flowchart Solution is project management workflow tools which is part ConceptDraw Project marketing project management software. Drawing charts, diagrams, and network layouts has long been the monopoly of Microsoft Visio, making Mac users to struggle when needing such visio alternative like visio for mac, it requires only to view features, make a minor edit to, or print a diagram or chart. Thankfully to MS Visio alternative like ConceptDraw PRO software, this is cross-platform charting and business process management tool, now visio alternative for making sort of visio diagram is not a problem anymore however many people still name it business process visio tools.
Data structure diagram with ConceptDraw PRO
Data structure diagram (DSD) is intended for description of conceptual models of data (concepts and connections between them) in the graphic format for more obviousness. Data structure diagram includes entities description, connections between them and obligatory conditions and requirements which connect them. Create Data structure diagram with ConceptDraw PRO.Fault Tree Diagram
ConceptDraw PRO diagramming and vector drawing software offers the Fault Tree Analysis Diagrams Solution from the Industrial Engineering Area of ConceptDraw Solution Park for quick and easy creating the Fault Tree Diagram of any degree of detailing.Sentence Diagrammer
Sentence a grammatical unit of several words, and provides a narrative, question, comment, etc. It begins with a capital letter and ends with proper punctuation. Sentence diagramming allows you to visually present the sentence part function, which helps you build right sentences. Language Learning solution offers the Sentence Diagrams Library with set of vector stencils for drawing various Sentence Diagrams, for visualizing grammatical structures that will assist you in language learning and construction of grammatically correct sentences. ConceptDraw PRO diagramming software extended with Language Learning solution from the Science and Education area provides the powerful sentence diagraming tools.Tree Network Topology Diagram
A Tree network topology (Hierarchical topology) is a hybrid network topology that contains the combination of two or more star networks connected via bus networks. Each star network is a LAN (local area network) with central computer or server and workstation nodes connected to it. The central computers of star networks are connected to a main cable that is called a bus. Each node of the Tree network can have an arbitrary number of child nodes, you can easy add/remove the separate workstations and even the whole star networks, the failure of one workstation will not affect the work of others. This topology is ideal solution when workstations are located in groups within a small physical region, rarely is used in WAN configurations. Computer and Networks solution from Computer and Networks area of ConceptDraw Solution Park contains templates, samples and numerous libraries of predesigned vector stencils of computer network devices and equipment, which can be effectively used for designing various network topologies diagrams, including Tree Network Topology.Flow Chart Online
Flow Chart is a great visualization tool for the flow of a process, algorithm or procedure with a lot of benefits. It is convenient to use a powerful software for creating flow charts. Now we have the best flow chart maker online design software - ConceptDraw PRO enhanced with Flowcharts Solution from the "Diagrams" Area of ConceptDraw Solution Park.Network Topology
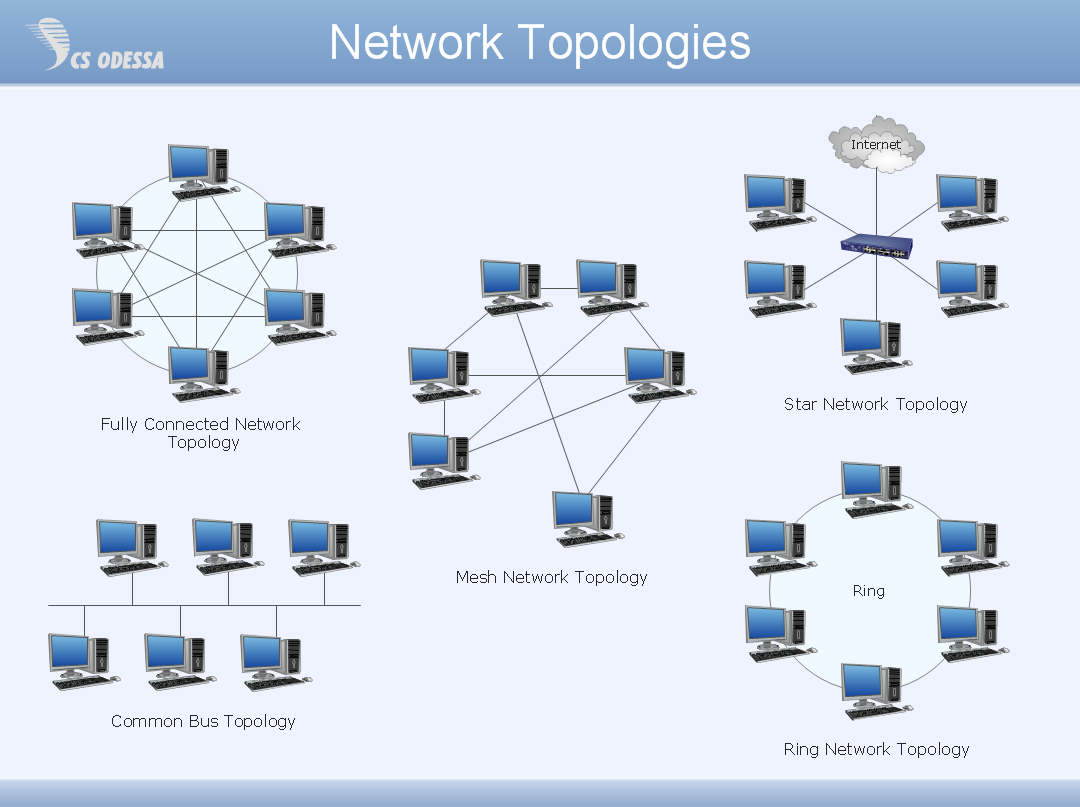
Network topology describes a way of organizing the physical connectivity of computers and other network components. All networks are built based on basic topologies: bus, star, ring, mesh. The basic topologies themselves are not complicated, but in practice we often face with their complex combinations. A particular choice of one or another topology affects the composition of necessary network equipment, opportunity of network expansion and method of network management. Bus topology is widespread and the most simple, it uses a single cable along which are connected all computers. In Star topology each computer is connected by a separate cable to common hub device located in a center of network. In networks with Ring topology, the data are transmitted around the ring from one computer to another, usually in one direction. In Mesh networks, only the computers with intensive data exchange are connected. ConceptDraw PRO software extended with powerful tools of solutions included to Computer and Networks area, contributes to high-quality design Network Topology Diagrams of different types.
Root Cause Tree Diagram
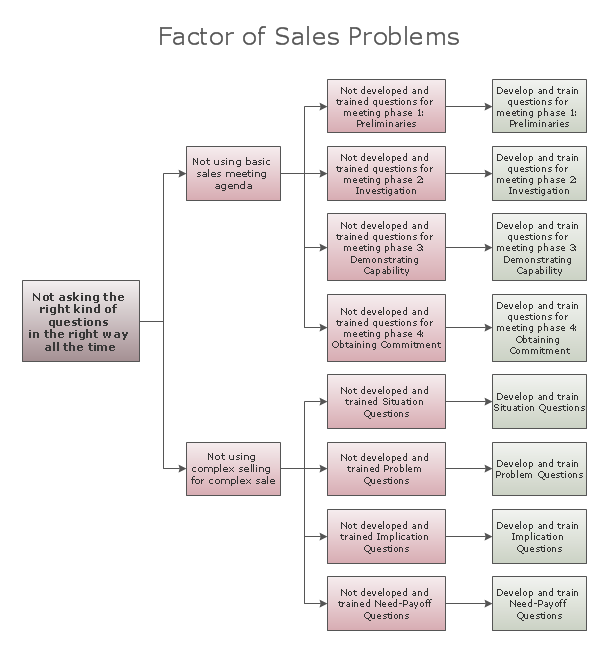
Root Cause Tree Diagram is one of the best tools to outline the problems and their causes, to analyze them and to formulate the possible corrective actions. Root Cause Tree Diagrams are successfully used in management, marketing, quality control and depth analysis, and are based on the principle that solution of any problem is concentrated at the root. Root Cause Tree Diagram contains the main problem on the top, from the top depart two branches of causes, which then diverge on additional causes, thus is constructed the hierarchy of root causes. So, the step by step defining of causes lets to detect the main reasons of a given effect and to make the correct arrangements to solve a problem. The ConceptDraw MINDMAP and ConceptDraw PRO products included to ConceptDraw Office suite, with help of Business Productivity solutions from the ConceptDraw Solution Park are effective in questions of problem solving, defining root causes of various problems, root causes analysis and designing the Root Cause Tree Diagrams.- Draw Fault Tree Analysis Online
- Entity-Relationship Diagram (ERD) | Online Sentence Tree Maker
- PROBLEM ANALYSIS. Root Cause Analysis Tree Diagram | Root ...
- ConceptDraw PRO Compatibility with MS Visio | Online Decision Tree
- Decision Tree Diagram For Online Shopping System
- Tree Diagram Generator Online Free
- How to Create an Enterprise Architecture Diagram in ConceptDraw ...
- Affinity Diagram | How To Create an Affinity Diagram Using ...
- Family Relationship In A Flow Chart
- Make Decision Tree Online


