Pyramid Chart Examples

"Brand awareness refers to customers' ability to recall and recognize the brand under different conditions and link to the brand name, logo, jingles and so on to certain associations in memory. It consists of both brand recognition and brand recall. It helps the customers to understand to which product or service category the particular brand belongs and what products and services are sold under the brand name. It also ensures that customers know which of their needs are satisfied by the brand through its products (Keller). Brand awareness is of critical importance since customers will not consider your brand if they are not aware of it. There are various levels of brand awareness that require different levels and combinations of brand recognition and recall. Top-of-Mind is the goal of most companies. Top-of-mind awareness occurs when your brand is what pops into a consumers mind when asked to name brands in a product category." [Brand. Brand awareness. Wikipedia]
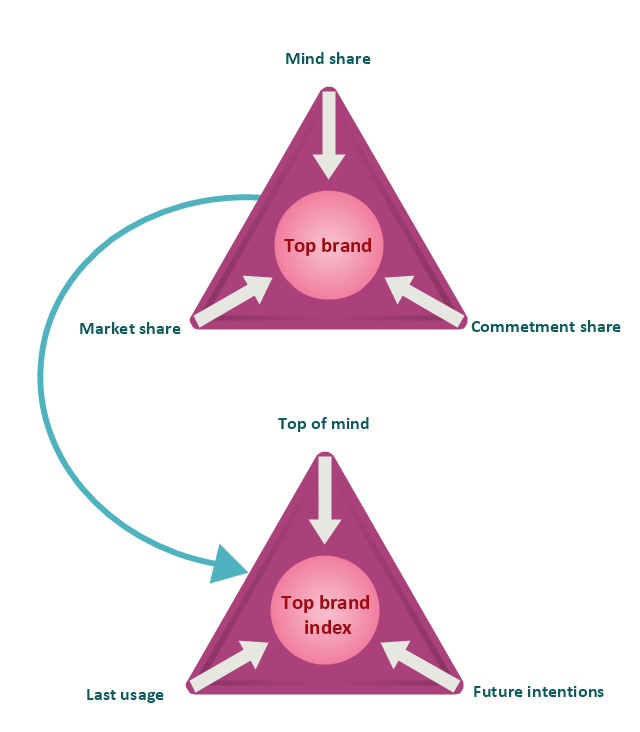
This top brand model pyramid diagram was redesigned using the ConceptDraw PRO diagramming and vector drawing software from Wikimedia Commons file Diagram Top Brand Model.jpg. [commons.wikimedia.org/ wiki/ File:Diagram_ Top_ Brand_ Model.jpg]
This file is licensed under the Creative Commons Attribution-Share Alike 3.0 Unported license. [creativecommons.org/ licenses/ by-sa/ 3.0/ deed.en]
The example "Top brand model pyramid diagram" is included in the Pyramid Diagrams solution from the Marketing area of ConceptDraw Solution Park.
Triangular charts
"Brand essence is a phrase that communicates the fundamental nature of a trade name associated with one or more products made by the same company. A business marketing team will often spend considerable time developing effective ways of expressing the brand essence of their company's various brands by highlighting the unique benefits provided that pertain to the values of its target subculture." [businessdictionary.com/ definition/ brand-essence.html]
Brand essence model diagram visually display key points of brand essence in easy to understand form.
The example of wheel diagram (ring diagram, bevel style circle diagram) "Brand essence model" was created using the ConceptDraw PRO diagramming and vector drawing software extended with the Target and Circular Diagrams solution from the Marketing area of ConceptDraw Solution Park.
www.conceptdraw.com/ solution-park/ marketing-target-and-circular-diagrams
Wheel diagram

 Pyramid Diagrams
Pyramid Diagrams solution extends ConceptDraw DIAGRAM software with templates, samples and library of vector stencils for drawing the marketing pyramid diagrams.
 Target and Circular Diagrams
This solution extends ConceptDraw DIAGRAM software with samples, templates and library of design elements for drawing the Target and Circular Diagrams.
Relative Circular Diagram
Six Markets Model Chart

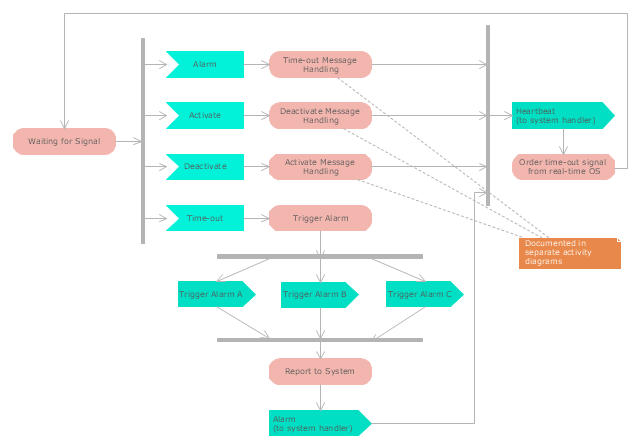
"Alarm triggers.
The individual triggers for a car alarm vary widely, depending on the make and model of the vehicle, and the brand and model of the alarm itself (for aftermarket alarms). Since aftermarket alarms are designed to be universal (i.e., compatible with all 12 volt negative ground electrical systems as opposed to one carmaker's vehicles), these commonly have trigger inputs that the installer/ vehicle owner chooses not to connect, which additionally determines what will set the alarm off." [Car alarm. Wikipedia]
The UML activity diagram example " Alarm trigger processing" was created using the ConceptDraw PRO diagramming and vector drawing software extended with the Rapid UML solution from the Software Development area of ConceptDraw Solution Park.
UML activity diagram
BPMN 2.0

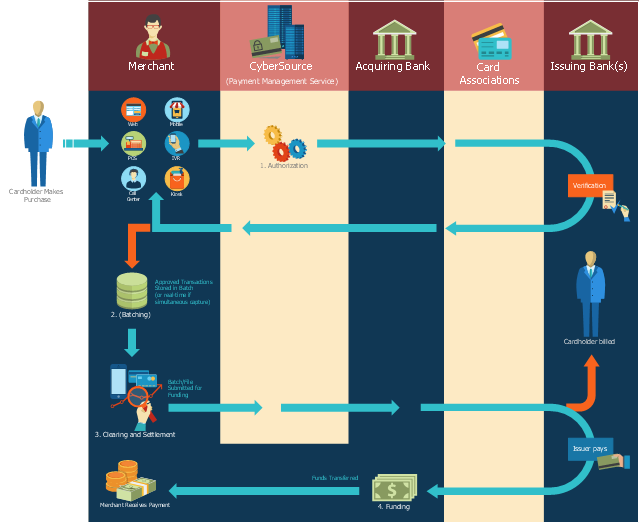
This payment process flowchart example was created on the base of the diagram of payment process using Global Payment Processing Services from the U.S. Securities and Exchange Commission website.
"Global Payment Processing Services. CyberSource Advanced enables merchants to accept payments made by all major credit and debit cards including American Express®, Discover®, Diners Club International®, JCB, MasterCard®, and Visa® cards. Our customers can also accept payment by corporate procurement cards, electronic checks, PayPal® Express Checkout, and the Bill Me Later® service. Merchants that have business models based on subscriptions can utilize the CyberSource recurring billing service with automated account updating services. For merchants selling internationally, we support direct debit, and bank transfers, as well as regional card brands such as Carte Bleue, Carta Si, Dankort, Laser, Solo, and Visa Electron. We provide these services for online, call center, kiosk, integrated voice response (“IVR”), and IP-enabled point of sale (“POS”) transactions."
[www.sec.gov/ Archives/ edgar/ data/ 934280/ 000119312510042764/ d10k.htm]
The flowchart example "Global Payment Solutions" was created using the ConceptDraw PRO diagramming and vector drawing software extended with the Sales Flowcharts solution from the Marketing area of ConceptDraw Solution Park.
Payment process flowchart
How to Create a Pyramid Diagram

Pyramid Charts

HelpDesk
How to Draw a Pyramid Diagram

- Top brand model - Pyramid diagram | Matrices | Marketing Area ...
- Brand essence model - Wheel diagram | Pyramid Chart Examples ...
- Brand essence model - Wheel diagram | Top brand model - Pyramid ...
- Pyramid Chart Examples | Brand essence model - Wheel diagram ...
- Brand essence model - Wheel diagram | Target and Circular ...
- Pyramid Chart Examples | How to Make SWOT Analysis in a Word ...
- Pyramid Diagram | 4 Level pyramid model diagram - Information ...
- Block diagram - Porter's five forces model | Block diagram - Branding ...
- Brands Available In Market Diagrams
- Target Diagram | Target and Circular Diagrams | Daily Schedule ...
- Service-goods continuum diagram | Pyramid Chart Examples ...
- Brand Positioning Chart Template
- Relative Circular Diagram | Marketing Diagrams | Target Diagram ...
- How to Create a Pie Chart | How to Create a Column Chart ...
- Target and Circular Diagrams | Design elements - Target and ...
- Business process diagram BPMN 1.2 - Hiring process | How to Draw ...
- Business Diagram Software | ConceptDraw Solution Park | Why ...
- Target Diagram | Target and Circular Diagrams | Daily Schedule ...
- UML activity diagram - Alarm trigger processing | Diagramming ...
- Marketing Diagrams | Marketing | Marketing and Sales Organization ...