This site uses cookies. By continuing to browse the ConceptDraw site you are agreeing to our Use of Site Cookies.

Product Overview

The role of ConceptDraw MINDMAP is to organize and plan idea development and communicate between process participants. Mind maps are convenient to prepare presentations for team and management and send task lists and related information.
HelpDesk

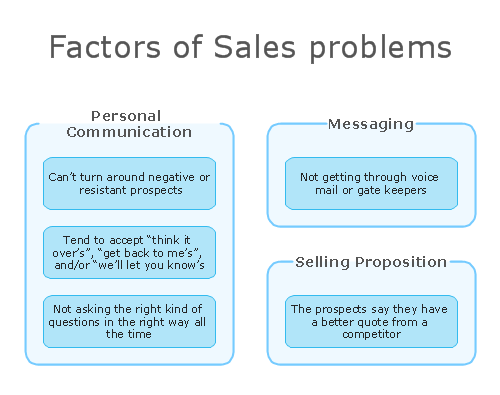
How To Create an Affinity Diagram Using Solutions

The affinity diagram is designed to prepare the data for further analysis of the cause-effect relationships. The Affinity diagram shows the structure of large, complex factors that have an influence on a problem, and then divides them up into a smaller and simpler structure. We recommend using a mind map for Brainstorming and collecting the factors affecting the problem. The ability to create an Affinity diagram from a mind map is supported by the ConceptDraw Seven Management and Planning Tools solution.

Affinity Diagram

The Affinity Diagram shows the structure of large, complex factors that have an influence on a problem, and then divides them up into a smaller and simpler structure. The Affinity Diagram does not show a causal relationship between the factors. This diagram is designed to prepare the data for further analysis of the cause-effect relationships.

Relations Diagram

Identify how factors influence each other. Factors mostly influencing called “Drivers” Primarily affected factors called “Indicators”. Problem solving further focuses on changing driver factors by corrective actions. Indicator factors help establish KPI (Key Performance Indicators) to monitor changes and the effectiveness of corrective actions in resolving a problem.

ConceptDraw MINDMAP : Brainstorming, Mind Mapping for macOS and Windows

ConceptDraw MINDMAP is a powerful business and personal productivity software application that provides visual organization and access to information for individuals and organizations.

Affinity Diagram

The affinity diagram is a business tool used to organize ideas and data. It is one of the Seven Management and Planning Tools. But how design the Affinity Diagram quick and easy? ConceptDraw DIAGRAM diagramming and vector drawing software offers the Seven Management and Planning Tools Solution from the Management Area.

Cause and Effect Analysis

When you have some problems you need first to explore the reasons which caused them. Cause and Effect Analysis is a perfect way to do this. ConceptDraw DIAGRAM software enhanced with Fishbone Diagrams solution from the Management area of ConceptDraw Solution Park gives the ability to draw fast and easy Fishbone diagram that identifies many possible causes for an effect.

Fishbone Diagram Problem Solving

The Ishikawa diagram, Cause and Effect diagram, Fishbone diagram — all they are the names of one and the same visual method for working with causal connections. Originally invented by Kaoru Ishikawa to control the process quality, the Ishikawa diagram is well proven in other fields of management and personal scheduling, events planning, time management. It is a chart in the form of a fish, whose head is a problem, the fins are variants for its causes.
To design easily the Fishbone diagram, you can use a special ConceptDraw DIAGRAM vector graphic and diagramming software which contains the powerful tools for Fishbone diagram problem solving offered by Fishbone Diagrams solution for the Management area of ConceptDraw Solution Park.

Use a Fishbone Diagram to Attack Complex Problems

Any project is a complex system which rarely goes without some problems, even the most minor. But the success of the project mostly depends from the ability effectively solve appearing problems. There are many methods for problem solving, one of the most effective is the use a Fishbone diagram to attack complex problems.
Use ConceptDraw DIAGRAM diagramming software with Fishbone Diagrams Solution to attack any complex problems with fishbone diagrams graphic method. Construct Fishbone diagram to help users brainstorm and break down a complex problem.

Affinity Diagram

The Affinity Diagram shows the structure of large, complex factors that have an influence on a problem, and then divides them up into a smaller and simpler structure. The Affinity Diagram does not show a causal relationship between the factors.
This diagram is designed to prepare the data for further analysis of the cause-effect relationships. A typical size for an Affinity Diagram is approximately 40-50 topics in a chart.