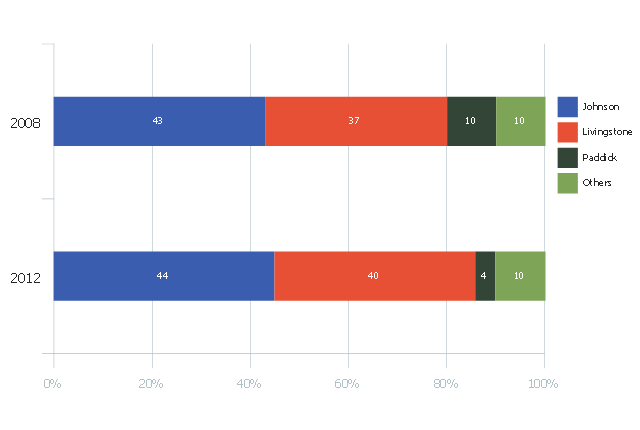
This divided bar chart sample was drawn on the base of the infographics "London Elections Results by Numbers" from the london.gov.uk website.
[data.london.gov.uk/ datastore/ package/ london-elections-results-2012-wards-boroughs-constituency]
"There are six types of elections in the United Kingdom: United Kingdom general elections, elections to devolved parliaments and assemblies, elections to the European Parliament, local elections, mayoral elections and Police and Crime Commissioner elections. Elections are held on Election Day, which is conventionally a Thursday. General elections do not have fixed dates, but must be called within five years of the opening of parliament following the last election. Other elections are held on fixed dates, though in the case of the devolved assemblies and parliaments early elections can occur in certain situations. Currently, six electoral systems are used: the single member plurality system (First Past the Post), the multi member plurality system, party list PR, the single transferable vote, the Additional Member System and the Supplementary Vote.
Elections are administered locally: in each lower-tier local authority, the actual polling procedure is run by the Returning Officer and the compiling and maintenance of the electoral roll by the Electoral Registration Officer (except in Northern Ireland, where the Electoral Office for Northern Ireland assumes both responsibilities). The Electoral Commission only sets standards for and issues guidelines to Returning Officers and Electoral Registration Officers, but is responsible for nationwide electoral administration (such as the registration of political parties and directing the administration of national referendums)." [Elections in the United Kingdom. Wikipedia]
The divided bar diagram example "London election results" was created using the ConceptDraw PRO diagramming and vector drawing software extended with the Divided Bar Diagrams solution from the Graphs and Charts area of ConceptDraw Solution Park.
Divided bar chart
Bar Diagram Math

 Divided Bar Diagrams
The Divided Bar Diagrams Solution extends the capabilities of ConceptDraw PRO v10 with templates, samples, and a library of vector stencils for drawing high impact and professional Divided Bar Diagrams and Graphs, Bar Diagram Math, and Stacked Graph.
Bar Diagrams for Problem Solving. Create space science bar charts with Bar Graphs Solution

Create bar graphs for visual solving your scientific problems and data comparison using the ConceptDraw PRO diagramming and vector drawing software extended with the Bar Graphs Solution from the Graphs and Charts area of ConceptDraw Solition Park.
Relative Value Chart Software

Relative values are widely used in:business, economics, investment, management, marketing, statistics, etc.
ConceptDraw PRO software is the best for drawing professional looking Relative Value Charts. ConceptDraw PRO provides Divided Bar Diagrams solution from the Graphs and Charts Area of ConceptDraw Solution Park.
HelpDesk
How to Draw a Divided Bar Chart in ConceptDraw PRO

 Bar Graphs
The Bar Graphs solution enhances ConceptDraw PRO v10 functionality with templates, numerous professional-looking samples, and a library of vector stencils for drawing different types of Bar Graphs, such as Simple Bar Graph, Double Bar Graph, Divided Bar Graph, Horizontal Bar Graph, Vertical Bar Graph, and Column Bar Chart.
 Winter Sports
The Winter Sports solution from Sport area of ConceptDraw Solution Park contains winter sports illustration examples, templates and vector clipart libraries.
 ConceptDraw Solution Park
ConceptDraw Solution Park collects graphic extensions, examples and learning materials
 Comparison Dashboard
Comparison dashboard solution extends ConceptDraw PRO software with samples, templates and vector stencils library with charts and indicators for drawing the visual dashboard comparing data.
 Scatter Diagrams
The Scatter Diagrams solution extends ConceptDraw PRO v10 functionality with templates, samples, and a library of vector stencils that make construction of a Scatter Plot easy. The Scatter Chart Solution makes it easy to design attractive Scatter Diagrams used in various fields of science, work, and life activities. ConceptDraw PRO lets you enter the data to the table and construct the Scatter Plot Graph automatically according to these data.
 Workflow Diagrams
Workflow Diagrams solution extends ConceptDraw PRO software with samples, templates and vector stencils library for drawing the work process flowcharts.
 Seven Basic Tools of Quality
Manage quality control in the workplace, using fishbone diagrams, flowcharts, Pareto charts and histograms, provided by the Seven Basic Tools of Quality solution.
 USA Maps
Use the USA Maps solution to create a map of USA, a US interstate map, printable US maps, US maps with cities and US maps with capitals. Create a complete USA states map.
 Event-driven Process Chain Diagrams
Event-driven Process Chain (EPC) Diagram is a type of flowchart widely used for modeling in business engineering and reengineering, business process improvement, and analysis. EPC method was developed within the Architecture of Integrated Information Systems (ARIS) framework.
- Divided bar diagram - London election results | Relative Value Chart ...
- Bar Diagram Math | Divided bar diagram - Template | London ...
- London election results - Divided bar diagram
- London election results - Divided bar diagram | Basic Flowchart ...
- Divided bar diagram
- London election results - Divided bar diagram | What is a Dashboard ...
- Divided Bar Diagrams
- Divided bar diagram template
- Federal timeline US prisoners - Area chart | London election results ...
- Divided bar diagram - London election results | 2012 United States ...
- Divided bar diagram - Template | How to Draw a Divided Bar Chart ...
- How to Draw a Divided Bar Chart in ConceptDraw PRO | Divided ...
- Basic Flowchart Images. Flowchart Examples | Donut Chart ...
- Bar Diagram Example
- Divided Bar Diagrams | Bar Diagram Math | Bar Diagrams for ...
- Divided Bar Diagrams | Basic Diagramming | Design elements ...
- Divided Bar Diagrams | Bar Graphs | Graphs and Charts Area ...
- How to Draw a Divided Bar Chart in ConceptDraw PRO | Divided ...
- Bar Diagrams for Problem Solving. Create space science bar charts ...
- Bar graph - Serious Crime in Cincinnati | How to Create a Column ...