Bar Chart Examples

How to Create a Bar Chart

Bar Graph

Sales Growth. Bar Graphs Example

Chart Examples

Chart Templates

Column Chart Examples

Business Report Pie. Pie Chart Examples

Bar Chart

Bar Diagrams for Problem Solving. Create business management bar charts with Bar Graphs Solution

Rainfall Bar Chart

Bar Diagrams for Problem Solving. Create event management bar charts with Bar Graphs Solution

Bar Diagrams for Problem Solving. Create economics and financial bar charts with Bar Graphs Solution

Bar Diagram Math

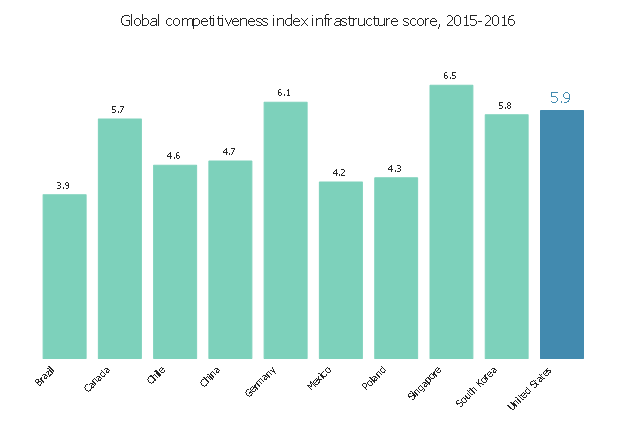
This vertical bar chart sample shows the global competitiveness index infrastructure score in 2015-2016. It was designed using data from the website "Assess Costs Everywhere (ACE)" of the United States Department of Commerce. [acetool.commerce.gov/ shipping]
"The Global Competitiveness Report (GCR) is a yearly report published by the World Economic Forum. Since 2004, the Global Competitiveness Report ranks countries based on the Global Competitiveness Index, developed by Xavier Sala-i-Martin and Elsa V. Artadi. Before that, the macroeconomic ranks were based on Jeffrey Sachs's Growth Development Index and the microeconomic ranks were based on Michael Porter's Business Competitiveness Index. The Global Competitiveness Index integrates the macroeconomic and the micro/ business aspects of competitiveness into a single index." [Global Competitiveness Report. Wikipedia]
The column graph example "Global competitiveness index infrastructure score chart" was created using the ConceptDraw PRO diagramming and vector drawing software extended with the Bar Graphs solution from the Graphs and Charts area of ConceptDraw Solution Park.
Vertical bar graph
- Changes in price indices - Double bar chart | Bar Chart Examples ...
- Changes in price indices - Double bar chart | How to Create a Bar ...
- Bar Chart Examples
- Bar Graph | Bar Chart Examples | Global competitiveness index ...
- Changes in price indices - Double bar chart | Double Bar Diagram In ...
- Changes in price indices - Double bar chart | Nitrate concentration in ...
- Example Of Bar Chart About The Economy
- Bar Chart Examples | Sales Growth. Bar Graphs Example | Financial ...
- Bar Chart Examples | Rainfall Bar Chart | How to Create a Bar Chart ...
- Bar Graph Use For Economy
- Bar Chart Examples | Bar Diagrams for Problem Solving. Create ...
- Bar Chart Template for Word | Bar Chart Examples | How to Create a ...
- Bar Chart Examples | Rainfall Bar Chart | Bar Chart Template for ...
- Bar Chart Examples | Bar Graphs | Nitrate concentration in ...
- Business Report Pie. Pie Chart Examples | Bar Chart Examples ...
- Double bar chart - Nitrate concentration in Community Water ...
- Sales Growth. Bar Graphs Example
- How to Create a Bar Chart in ConceptDraw PRO | Bar Diagrams for ...
- Sales Growth. Bar Graphs Example | Bar Graphs | Bar Graph ...
- Bar Graphs On Agricultural Economy