The vector stencils library "Education charts" contains 12 graphs and charts: area chart, column chart, divided bar diagram, histogram, horizontal bar graph, line graph, pie chart, ring chart, scatter plot.
Use it to create your educational infograms.
"A chart can take a large variety of forms, however there are common features that provide the chart with its ability to extract meaning from data.
Typically the data in a chart is represented graphically, since humans are generally able to infer meaning from pictures quicker than from text. Text is generally used only to annotate the data.
One of the more important uses of text in a graph is the title. A graph's title usually appears above the main graphic and provides a succinct description of what the data in the graph refers to.
Dimensions in the data are often displayed on axes. If a horizontal and a vertical axis are used, they are usually referred to as the x-axis and y-axis respectively. Each axis will have a scale, denoted by periodic graduations and usually accompanied by numerical or categorical indications. Each axis will typically also have a label displayed outside or beside it, briefly describing the dimension represented. If the scale is numerical, the label will often be suffixed with the unit of that scale in parentheses. ...
The data of a chart can appear in all manner of formats, and may include individual textual labels describing the datum associated with the indicated position in the chart. The data may appear as dots or shapes, connected or unconnected, and in any combination of colors and patterns. Inferences or points of interest can be overlaid directly on the graph to further aid information extraction.
When the data appearing in a chart contains multiple variables, the chart may include a legend (also known as a key). A legend contains a list of the variables appearing in the chart and an example of their appearance. This information allows the data from each variable to be identified in the chart." [Chart. Wikipedia]
The shapes example "Design elements - Education charts" was created using the ConceptDraw PRO diagramming and vector drawing software extended with the Education Infographics solition from the area "Business Infographics" in ConceptDraw Solution Park.
Graphs and charts

UML Timing Diagram, Design Elements

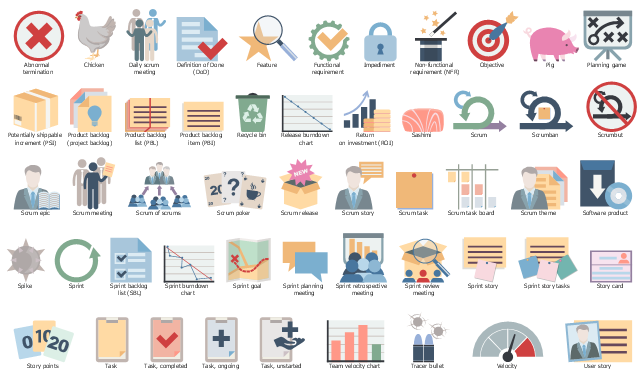
The vector stencils library "Scrum artifacts" contains 52 icons.
Use this clipart set to design your agile software development diagrams and infographics with ConceptDraw PRO software.
"Product backlog
The product backlog comprises an ordered list of requirements that a scrum team maintains for a product. It consists of features, bug fixes, non-functional requirements, etc.—whatever must be done to successfully deliver a viable product. The product owner orders the product backlog items (PBIs) based on considerations such as risk, business value, dependencies, and date needed. ...
Sprint backlog
The sprint backlog is the list of work the development team must address during the next sprint. The list is derived by the scrum team selecting product backlog items from the top of the product backlog until the development team feels it has enough work to fill the sprint. This is done by the development team asking "Can we also do this?" and adding product backlog items to the sprint backlog. The development team should keep in mind its past performance assessing its capacity for the new sprint, and use this as a guide line of how much "effort" they can complete.
The product backlog items may be broken down into tasks by the development team. Tasks on the sprint backlog are never assigned; rather, tasks are signed up for by the team members as needed according to the set priority and the development team member skills. This promotes self-organization of the development team, and developer buy-in. ...
Sprint burn-down chart
The sprint burndown chart is a public displayed chart showing remaining work in the sprint backlog. Updated every day, it gives a simple view of the sprint progress. ...
Release burn-down chart
The release burndown chart is the way for the team to track progress and provide visibility. The release burndown chart is updated at the end of each sprint by the scrum master. The horizontal axis of the release burndown chart shows the sprints; the vertical axis shows the amount of work remaining at the start of each sprint." [Scrum (software development). Wikipedia]
The clip art sample "Design elements - Scrum artifacts" is included in the Scrum solution from the Project Management area of ConceptDraw Solution Park.
Clipart set
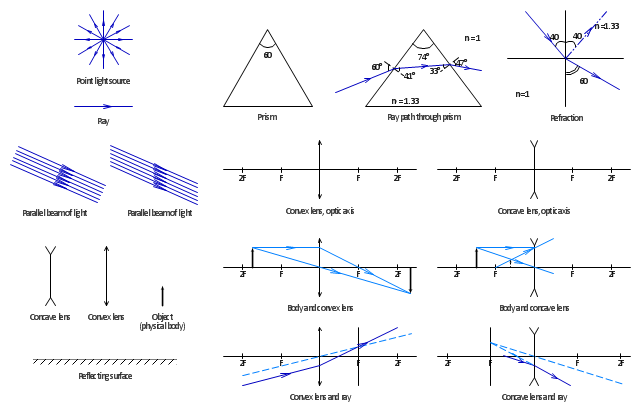
The vector stencils library "Optics" contains 17 symbol icons: reflecting surface; convex and concave lens with and without optic axis, body or ray; ray; parallel beam of light; point light source; prism with and without ray path; refraction.
Use these shapes for drawing schemes of physical experiments in geometrical optics and ray tracing diagrams.
"Geometrical optics, or ray optics, describes light propagation in terms of "rays". The "ray" in geometric optics is an abstraction, or "instrument", which can be used to approximately model how light will propagate. Light rays are defined to propagate in a rectilinear path as they travel in a homogeneous medium. Rays bend (and may split in two) at the interface between two dissimilar media, may curve in a medium where the refractive index changes, and may be absorbed and reflected. Geometrical optics provides rules, which may depend on the color (wavelength) of the ray, for propagating these rays through an optical system. This is a significant simplification of optics that fails to account for optical effects such as diffraction and interference. It is an excellent approximation, however, when the wavelength is very small compared with the size of structures with which the light interacts. Geometric optics can be used to describe the geometrical aspects of imaging, including optical aberrations." [Geometrical optics. Wikipedia]
The example "Design elements - Optics" was created using the ConceptDraw PRO diagramming and vector drawing software extended with the Physics solution from the Science and Education area of ConceptDraw Solution Park.
Optical symbols
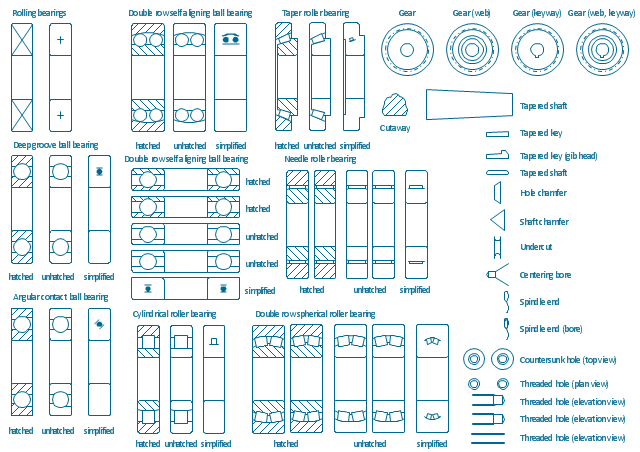
The vector stencils library "Bearings" contains 59 symbols of ball bearings, roller bearings, shafts, springs, gears, hooks, spindles, and keys.
Use it to design engineering drawings of machine tools and mechanical devices.
"A bearing is a machine element that constrains relative motion and reduce friction between moving parts to only the desired motion. The design of the bearing may, for example, provide for free linear movement of the moving part or for free rotation around a fixed axis; or, it may prevent a motion by controlling the vectors of normal forces that bear on the moving parts. Many bearings also facilitate the desired motion as much as possible, such as by minimizing friction. Bearings are classified broadly according to the type of operation, the motions allowed, or to the directions of the loads (forces) applied to the parts." [Bearing (mechanical). Wikipedia]
The shapes example "Design elements - Bearings" was created using the ConceptDraw PRO diagramming and vector drawing software extended with the Mechanical Engineering solution from the Engineering area of ConceptDraw Solution Park.
Bearing symbols
UML Activity Diagram. Design Elements


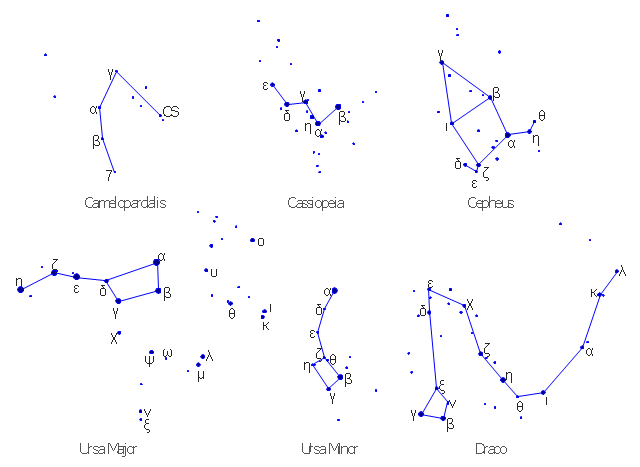
The vector stencils library "Northern constellations" contains 6 star constellation maps for drawing astronomical diagrams.
"There are no markings on the night sky, though there exist many sky maps to aid stargazers in identifying constellations and other celestial objects. Constellations are prominent because their stars tend to be brighter than other nearby stars in the sky. Different cultures have created different groupings of constellations based on differing interpretations of the more-or-less random patterns of dots in the sky. Constellations were identified without regard to distance to each star, but instead as if they were all dots on a dome.
Orion is among the most prominent and recognizable constellations. The Big Dipper (which has a wide variety of other names) is helpful for navigation in the northern hemisphere because it points to Polaris, the north star.
The pole stars are special because they are approximately in line with the Earth's axis of rotation so they appear to stay in one place while the other stars rotate around them through the course of a night (or a year)." [Night sky. Wikipedia]
The example "Design elements - Northern constellations" was created using the ConceptDraw PRO diagramming and vector drawing software extended with the Astronomy solution from the Science and Education area of ConceptDraw Solution Park.
Northern constellations - Star maps
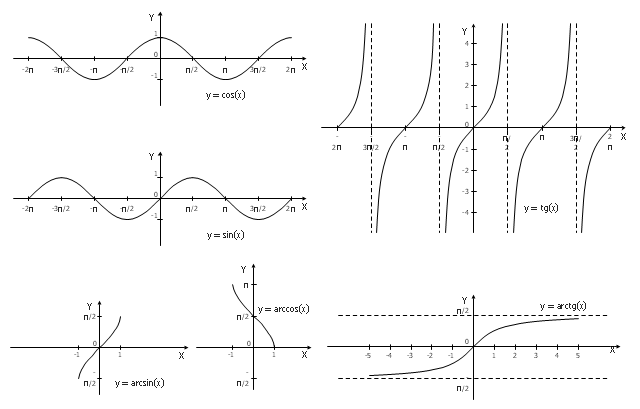
The vector stencils library "Trigonometric functions" contains 8 shapes of trigonometrical and inverse trigonometrical functions graphs.
"In mathematics, the trigonometric functions (also called the circular functions) are functions of an angle. They relate the angles of a triangle to the lengths of its sides. Trigonometric functions are important in the study of triangles and modeling periodic phenomena, among many other applications.
The most familiar trigonometric functions are the sine, cosine, and tangent. In the context of the standard unit circle with radius 1 unit, where a triangle is formed by a ray originating at the origin and making some angle with the x-axis, the sine of the angle gives the length of the y-component (the opposite to the angle or the rise) of the triangle, the cosine gives the length of the x-component (the adjacent of the angle or the run), and the tangent function gives the slope (y-component divided by the x-component). More precise definitions are detailed below. Trigonometric functions are commonly defined as ratios of two sides of a right triangle containing the angle, and can equivalently be defined as the lengths of various line segments from a unit circle. More modern definitions express them as infinite series or as solutions of certain differential equations, allowing their extension to arbitrary positive and negative values and even to complex numbers." [Trigonometric functions. Wikipedia]
The shapes example "Design elements - Trigonometric functions" was created using the ConceptDraw PRO diagramming and vector drawing software extended with the Mathematics solution from the Science and Education area of ConceptDraw Solution Park.
Trigonometrical and inverse trigonometrical functions - Graphs
How to Create a Scatter Chart

Scatter Chart Examples

Timeline Diagrams

 SWOT and TOWS Matrix Diagrams
SWOT and TOWS Matrix Diagrams solution extends ConceptDraw DIAGRAM and ConceptDraw MINDMAP software with features, templates, samples and libraries of vector stencils for drawing SWOT and TOWS analysis matrices and mind maps.
Bar Graph

 Scatter Diagrams
The Scatter Diagrams solution extends ConceptDraw DIAGRAM functionality with templates, samples, and a library of vector stencils that make construction of a Scatter Plot easy. The Scatter Chart Solution makes it easy to design attractive Scatter Diagrams used in various fields of science, work, and life activities. ConceptDraw DIAGRAM lets you enter the data to the table and construct the Scatter Plot Graph automatically according to these data.
UML Notation

- Design elements - Optics | What Is Axis In Element Of Design Using ...
- Design elements - Education charts | How to Draw a Scatter ...
- Design elements - Time series charts | SWOT and TOWS Matrix ...
- Design elements - Time series charts | Line Graph | Design ...
- Design elements - Education charts | SWOT and TOWS Matrix ...
- Line Graph | How to Create a Line Chart | Design elements - Line ...
- Design elements - Marketing charts | SWOT and TOWS Matrix ...
- How to Create a Line Chart | Design elements - Time series charts ...
- Trigonometric functions - Vector stencils library | Design elements ...
- Marketing Charts | Design elements - Marketing charts | Market ...
- Design elements - Time series charts | Line Chart Examples ...
- Optics - Vector stencils library | Design elements - Optics | Reflection ...
- Design elements - Marketing charts | Design elements - Area charts ...
- Marketing Flow Chart | Marketing Organization Chart | Design ...
- Design elements - Time series charts | Line Chart Examples | Line ...
- Bar Graph | Design elements - Marketing charts | Composition ...
- Ray tracing diagram for convex lens | Optics - Vector stencils library ...
- Design elements - Picture graphs | Design elements - Time series ...
- Optics - Vector stencils library | Design elements - Optics | Welding ...
- Design elements - Solid geometry | Design elements - Optics | Solid ...