This vehicular network diagram example was drawn on the base of picture illustrating the article "Automatic Vehicle Location: Rural Transit" from the website of the Research and Innovative Technology Administration (RITA), U.S. Department of Transportation (US DOT).
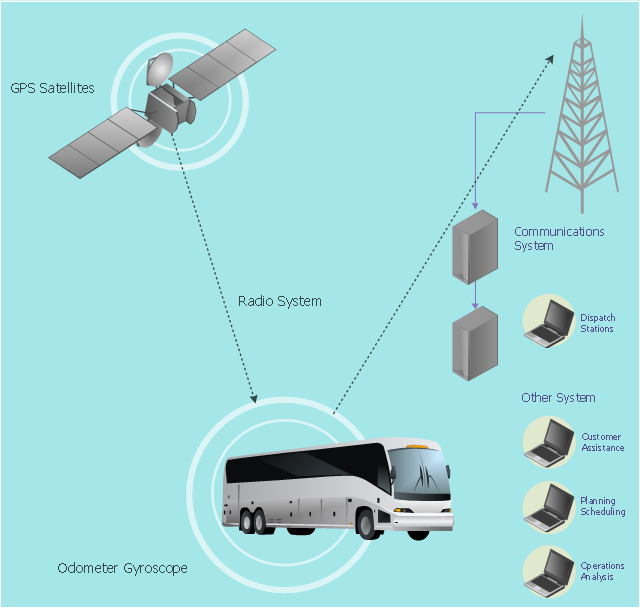
"Automatic Vehicle Location (AVL) systems calculate the real-time location of any vehicle equipped with a Global Positioning Satellite (GPS) receiver. Data are then transmitted to the transit center with use of radio or cellular communications and can be used immediately for daily operations as well as archived for further analysis.
As a stand-alone technology, an AVL system can be used to monitor on-time performance. When combined with other technologies, AVL can deliver many benefits in the areas of fleet management, service planning, safety and security, traveler information, fare payment, vehicle component monitoring, and data collection. Since the greatest benefits from AVL are achieved by combining it with other Intelligent Transportation System (ITS) technologies, AVL is most appropriate for large rural agencies with more than 30 vehicles that plan to implement a comprehensive ITS."
[pcb.its.dot.gov/ factsheets/ avl/ avlRural_ overview.asp]
The vehicular network diagram example "Automatic vehicle location" was created using the ConceptDraw PRO diagramming and vector drawing software extended with the Vehicular Networking solution from the Computer and Networks area of ConceptDraw Solution Park.
Vehicular network diagram
Used Solutions
Network Diagramming with ConceptDraw DIAGRAM
Network Visualization with ConceptDraw DIAGRAM

ConceptDraw DIAGRAM Network Diagram Tool


The Data flow diagram (DFD) example "Payment for goods using UPS code scanner" shows data flow in process of payment for goods in the shop using the MaxiCode scanner.
"MaxiCode is a public domain, machine-readable symbol system originally created and used by United Parcel Service. Suitable for tracking and managing the shipment of packages, it resembles a barcode, but uses dots arranged in a hexagonal grid instead of bars. MaxiCode has been standardised under ISO/ IEC 16023.
A MaxiCode symbol (internally called "Bird's Eye", "Target", "dense code", or "UPS code") appears as a 1 inch square, with a bullseye in the middle, surrounded by a pattern of hexagonal dots. It can store about 93 characters of information, and up to 8 MaxiCode symbols can be chained together to convey more data. The centered symmetrical bullseye is useful in automatic symbol location regardless of orientation, and it allows MaxiCode symbols to be scanned even on a package traveling rapidly." [MaxiCode. Wikipedia]
This example of data flow diagram (Gane & Sarson notation) was created using the ConceptDraw PRO diagramming and vector drawing software extended with the Data Flow Diagrams solution from the Software Development area of ConceptDraw Solution Park.
DFD
---payment-for-goods-using-ups-code-scanner.png--diagram-flowchart-example.png)
Cross Functional Flowchart Examples

Software Diagram Examples and Templates

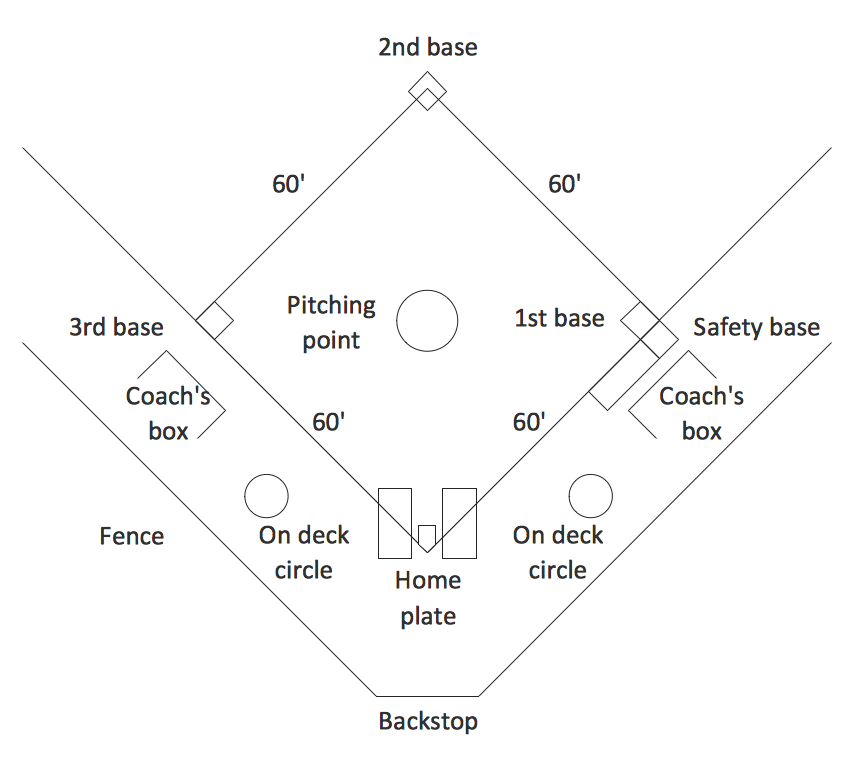
Simple Baseball Field — Sample
Software and Database Design with ConceptDraw DIAGRAM

Software Diagrams

- Aerospace vehicle examples | Truck vehicle clipart | Automatic ...
- Computers and network isometric - Vector stencils library | Building ...
- Industrial vehicles - Vector stencils library | Design elements ...
- Bus network topology diagram | Automatic vehicle location | Network ...
- Vehicular Networking | Automatic vehicle location | Inter-vehicle ...
- Unified communications diagram | Computers and network isometric ...
- Automated Car Parking System Use Case Diagram
- Communications - Vector stencils library | Communications - Vector ...
- Telecommunication networks - Vector stencils library | Design ...
- Intelligent transportation system | Fishbone Diagrams | Automatic ...