Business Process Workflow Diagram


Flowchart design. Flowchart symbols, shapes, stencils and icons


 Presentation Clipart
Presentation design elements solution extends ConceptDraw DIAGRAM software with slide samples, templates and vector stencils libraries with design elements of presentation symbols, arrows, callouts, backgrounds, borders and frames, title blocks.
 Circular Arrows Diagrams
Circular Arrows Diagrams solution extends ConceptDraw DIAGRAM with extensive drawing tools, predesigned samples, Circular flow diagram template for quick start, and a library of ready circular arrow vector stencils for drawing Circular Arrow Diagrams, Segmented Cycle Diagrams, and Circular Flow Diagrams. The elements in this solution help managers, analysts, business advisers, marketing experts, scientists, lecturers, and other knowledge workers in their daily work.
Circular Arrow
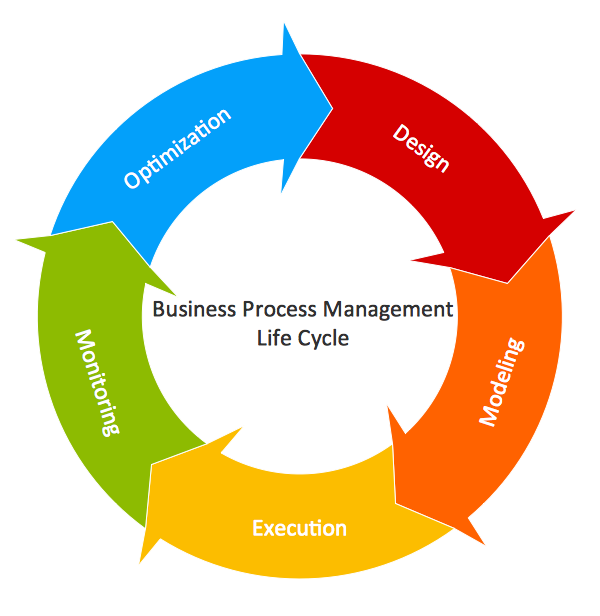
Business Process Optimization
 Basic Circular Arrows Diagrams
This solution extends ConceptDraw DIAGRAM (or later) with samples, templates, and a library of vector stencils for drawing circular arrow diagrams.
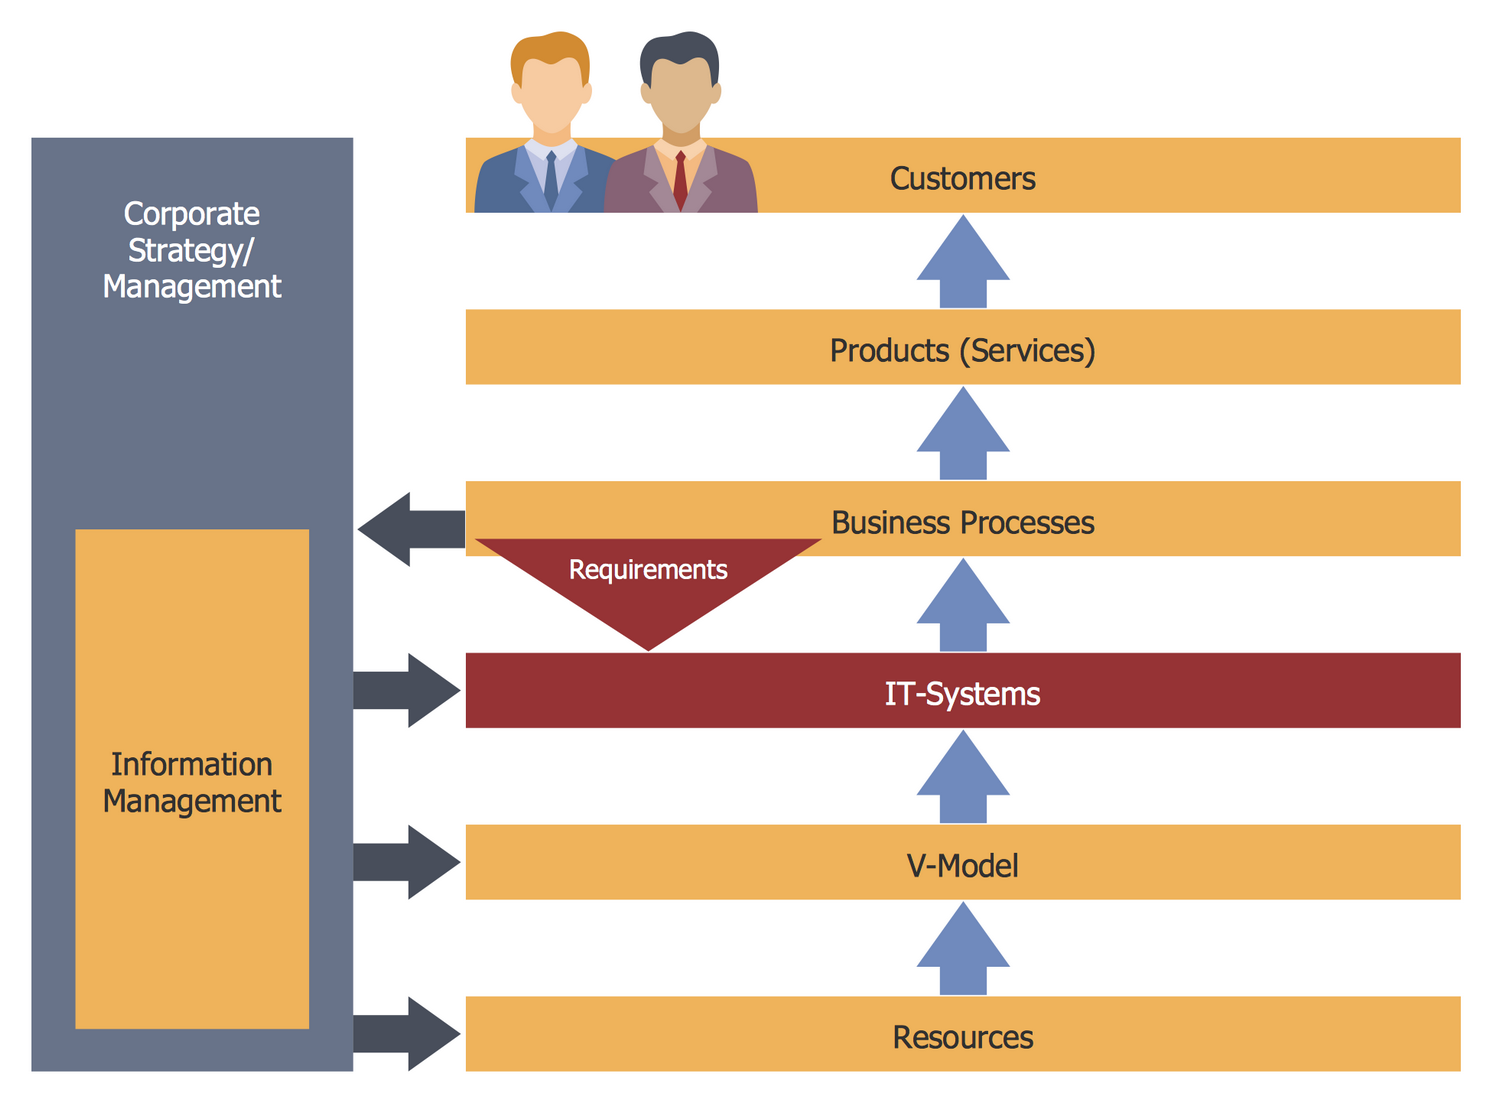
 Business Process Workflow Diagrams
The Business Process Workflow Diagrams solution enhances the ConceptDraw DIAGRAM functionality with predesigned examples, samples and a numerous collection of predesigned vector objects of workflow chart elements, icons, arrows, connectors, and varied wor
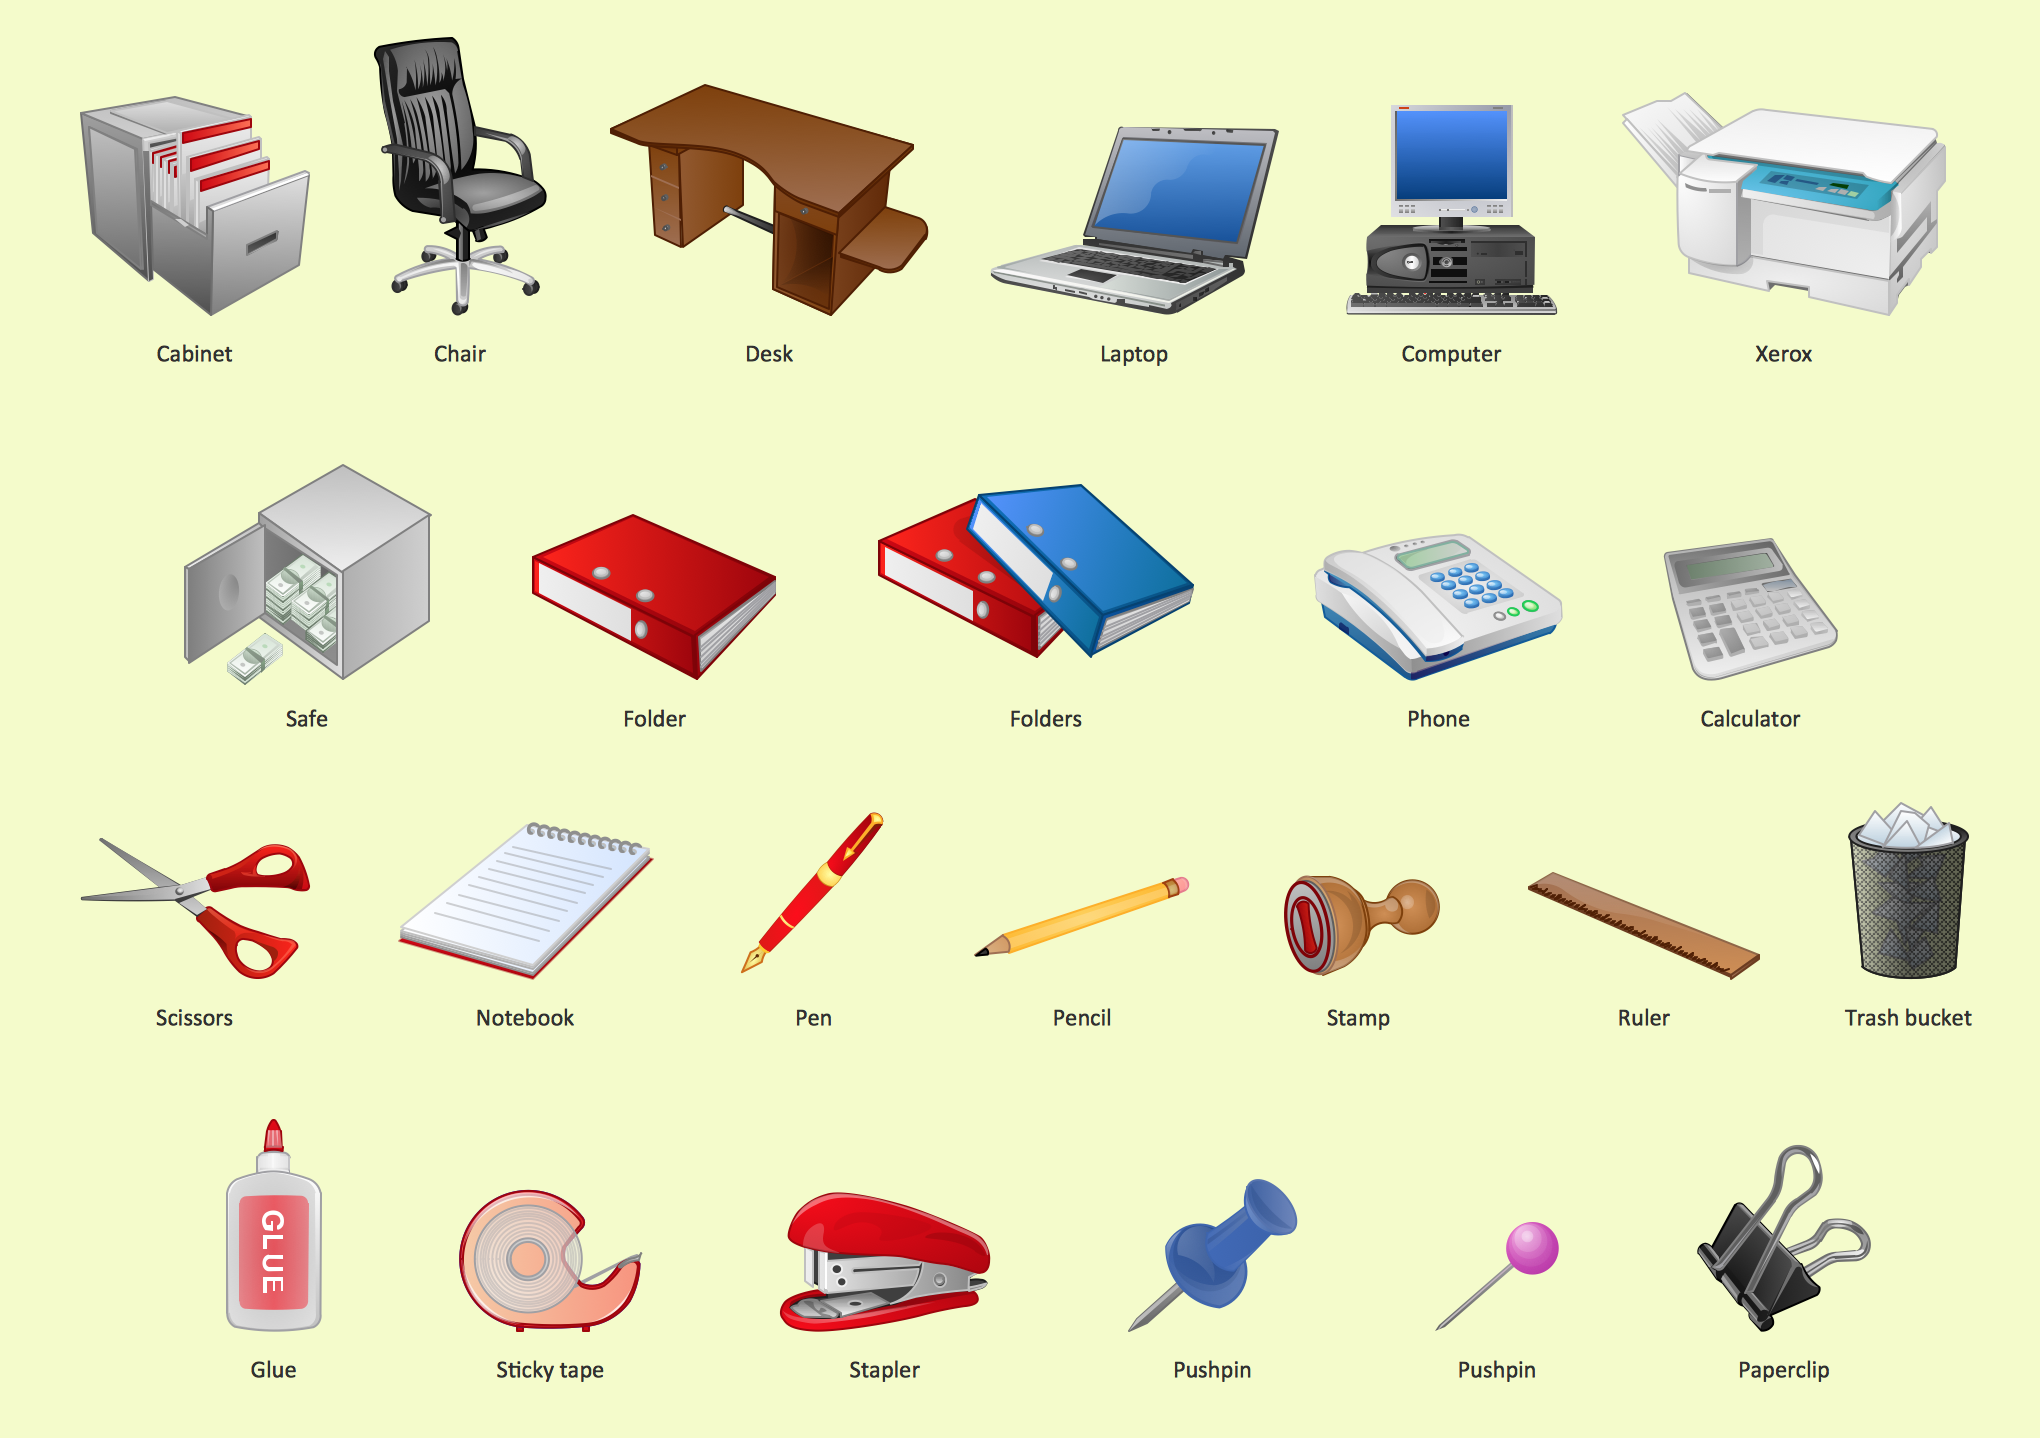
 Business and Finance
Use Business and Finance solution to make professional-looking documents, presentations and websites, business, finance, advertising, and project management illustrations, or any designs that requires clipart of currency, office, business, advertising, management, marketing, people, time, post, contacts, collaboration, etc.
 IDEF Business Process Diagrams
Use the IDEF Business Process Diagrams solution to create effective database designs and object-oriented designs, following the integration definition methodology.
 Business Package for Management
Package intended for professional who designing and documenting business processes, preparing business reports, plan projects and manage projects, manage organizational changes, prepare operational instructions, supervising specific department of an organization, workout customer service processes and prepare trainings for customer service personal, carry out a variety of duties to organize business workflow.
 Pie Charts
Pie Charts are extensively used in statistics and business for explaining data and work results, in mass media for comparison (i.e. to visualize the percentage for the parts of one total), and in many other fields. The Pie Charts solution for ConceptDraw DIAGRAM offers powerful drawing tools, varied templates, samples, and a library of vector stencils for simple construction and design of Pie Charts, Donut Chart, and Pie Graph Worksheets.
Use Case Diagrams technology with ConceptDraw DIAGRAM

 Business Process Model and Notation
Business Process Model and Notation Solution for ConceptDraw DIAGRAM is helpful for modeling the business processes of any degree of complexity, documenting them and effective creating diagrams using the BPMN 2.0 standard.
Office - Design Elements
- Arrow Blue Png
- Rounded Arrow Png
- Partnership Clipart Png
- Circular Arrows Diagrams | Business Process Workflow Diagrams ...
- Presentation design elements - Vector clipart library | Arrows ...
- Presentation design elements - Vector clipart library | Arrows ...
- Arrow Png White
- Presentation Clipart | Business Process Workflow Diagram | Circular ...
- Free Arrows In Circle Clip Art Png
- Arrows - Vector clipart library | Presentation Clipart | Illustration ...
- Arrows Png Blue
- Arrows - Vector clipart library | Design elements - Arrows ...
- Chart Clipart Png
- Circle Arrow Png
- Circular Arrows Diagrams | Arrows - Vector clipart library | How to ...
- Arrow Graphic Vector Png
- Bracket Arrow Vector Png
- Process Clipart Png
- Clipart Background Designs Png
- Arrows Infographic Icons Png