HelpDesk
How to Create Education Infographics

HelpDesk
How to Create Data-driven Infographics

HelpDesk
How to Create Management Infographics Using ConceptDraw PRO

 macOS User Interface
macOS User Interface solution extends the ConceptDraw PRO functionality with powerful GUI software graphic design features and tools. It provides an extensive range of multifarious macOS Sierra user interface design examples, samples and templates, and wide variety of libraries, containing a lot of pre-designed vector objects of Mac Apps icons, buttons, dialogs, menu bars, indicators, pointers, controls, toolbars, menus, and other elements for fast and simple designing high standard user interfaces of any complexity for new macOS Sierra.


HelpDesk
How to Draw a Fishbone Diagram with ConceptDraw PRO

 iPhone User Interface
iPhone User Interface solution extends ConceptDraw PRO v10 software with templates, samples and libraries with large quantity of vector stencils of graphical user interface elements, Apps icons, UI patterns for designing and prototyping of the iOS applic
Managing the task list

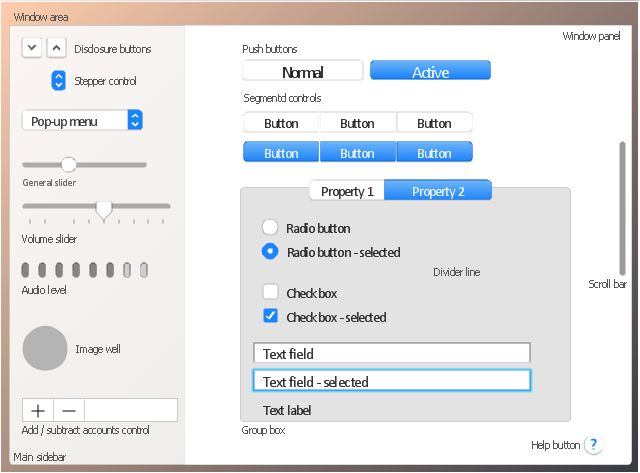
The vector stencils library "General window elements" contains 31 window elements.
Use this window UI icon set to design graphic user interface (GUI) of your software application for OS X 10.10 Yosemite Apple Mac operating system.
"A window provides a frame for viewing and interacting with content in an app. ...
A window consists of window-frame areas and a window body. The window-frame areas are the title bar and toolbar, which are typically combined. ... The window body can extend from the top edge of the window (that is, underneath the combined title bar/ toolbar area) to the bottom edge of the window.
The window body represents the main content area of the window. ...
OS X defines appearances that can affect the look of controls and views in particular contexts, such as a window’s sidebar. ...
OS X specifies a set of control/ style combinations that are designed to look good on the toolbar, whether the toolbar is translucent or opaque. ...
Every document window, app window, and panel has, at a minimum:
- A title bar (or a combined title bar and toolbar), so that users can move the window.
- A close button, so that users have a consistent way to dismiss the window.
A standard document window may also have the following additional elements that an app window or panel might not have:
- Transient horizontal or vertical scroll bars, or both (if not all the window’s contents are visible).
- Minimize and fullscreen buttons (note that the fullscreen button changes to a zoom button if the window doesn’t support fullscreen mode or when users hold down the Option key).
- A proxy icon and a versions menu (after the user has given a document a name and save location for the first time).
- The title of the document (that functions as the title of the window).
- Transient resize controls." [https:/ / developer.apple.com/ library/ mac/ documentation/ UserExperience/ Conceptual/ OSXHIGuidelines/ WindowAppearanceBehavior.html#/ / apple_ ref/ doc/ uid/ 20000957-CH33-SW1]
The example "Design elements - General window elements" was created using the ConceptDraw PRO diagramming and vector drawing software extended with the Mac OS User Interface solution from the Software Development area of ConceptDraw Solution Park.
Window elements
Cross-Functional Flowchart


 MindTweet
This solution extends ConceptDraw MINDMAP software with the ability to brainstorm, review and organize the sending of Tweets.
 Android User Interface
The Android User Interface solution allows ConceptDraw PRO act as an Android UI design tool. Libraries and templates contain a variety of Android GUI elements to help users create images based on Android UI design.
Software and Database Design with ConceptDraw PRO

 Computer Network Diagrams
Computer Network Diagrams solution extends ConceptDraw PRO software with samples, templates and libraries of vector icons and objects of computer network devices and network components to help you create professional-looking Computer Network Diagrams, to plan simple home networks and complex computer network configurations for large buildings, to represent their schemes in a comprehensible graphical view, to document computer networks configurations, to depict the interactions between network's components, the used protocols and topologies, to represent physical and logical network structures, to compare visually different topologies and to depict their combinations, to represent in details the network structure with help of schemes, to study and analyze the network configurations, to communicate effectively to engineers, stakeholders and end-users, to track network working and troubleshoot, if necessary.
 Picture Graphs
Typically, a Picture Graph has very broad usage. They many times used successfully in marketing, management, and manufacturing. The Picture Graphs Solution extends the capabilities of ConceptDraw PRO v10 with templates, samples, and a library of professionally developed vector stencils for designing Picture Graphs.
- Ui Arrows
- Menu Icon Down
- Button Dropdown Down Arrow
- Vector stencils library | Drop Down Menu Arrow Png
- Arrow Icon
- Expand Menu Icon
- Arrow Menu Png
- Downward Glyph Arrow
- Ui Arrow Png
- Vector stencils library | Menu Triangle Arrow
- Chevron Menu Icon
- Basic Flowchart Symbols and Meaning | Sales arrows - Vector ...
- Arrow Image Down
- Page Divider Icon Png
- Triangle To Expand
- Circular arrows diagrams - Vector stencils library
- Glyph icons - Vector stencils library
- Arrow Button Icon
- Down Triangle Vector
- Menu Icon Apple