The vector clipart library "Arrows" contains 37 arrows which you can easy use in your presentation slides and illustrations.
The clip art example "Arrows - Vector clipart library" was created in the ConceptDraw PRO diagramming and vector drawing software using the Presentation Clipart solution from the Illustration area of ConceptDraw Solution Park.
The clip art example "Arrows - Vector clipart library" was created in the ConceptDraw PRO diagramming and vector drawing software using the Presentation Clipart solution from the Illustration area of ConceptDraw Solution Park.
Moving up

Vertical moving

Moving down

Interaction arrows

Wavy arrow
Circular motion

Goal achievement

Moving ahead

Opposite direction

Motive forces

Arrow backward
Arrow forward
Arrow left
Arrow right
Arrow 1
Arrow 2
Arrow 3
Horizontal double arrow
Connecting arrow
Arched down

Arched up

Circular

Leftward

Rightward

Leftward blue

Rightward blue

Arrow backward round
Arrow forward round
Arrow round
Arrow left rounded square
Arrow right rounded square
Arrow 2 rounded square
Arrow 3 rounded square
Arrow forward square
Arrow backward square
Arrow left (white background)
Arrow right (white background)
How to Create Presentation of Your Project Gantt Chart

The vector clipart library "Arrows" contains 37 arrows which you can easy use in your presentation slides and illustrations.
The clip art example "Arrows - Vector clipart library" was created in the ConceptDraw PRO diagramming and vector drawing software using the Presentation Clipart solution from the Illustration area of ConceptDraw Solution Park.
The clip art example "Arrows - Vector clipart library" was created in the ConceptDraw PRO diagramming and vector drawing software using the Presentation Clipart solution from the Illustration area of ConceptDraw Solution Park.
Moving up
Vertical moving
Moving down
Interaction arrows
Wavy arrow
Circular motion
Goal achievement
Moving ahead
Opposite direction
Motive forces
Arrow backward
Arrow forward
Arrow left
Arrow right
Arrow 1
Arrow 2
Arrow 3
Horizontal double arrow
Connecting arrow
Arched down
Arched up
Circular
Leftward
Rightward
Leftward blue
Rightward blue
Arrow backward round
Arrow forward round
Arrow round
Arrow left rounded square
Arrow right rounded square
Arrow 2 rounded square
Arrow 3 rounded square
Arrow forward square
Arrow backward square
Arrow left (white background)
Arrow right (white background)
 Presentation Clipart
Presentation design elements solution extends ConceptDraw DIAGRAM software with slide samples, templates and vector stencils libraries with design elements of presentation symbols, arrows, callouts, backgrounds, borders and frames, title blocks.
 iPhone User Interface
iPhone User Interface solution extends ConceptDraw DIAGRAM software with templates, samples and libraries with large quantity of vector stencils of graphical user interface elements, Apps icons, UI patterns for designing and prototyping of the iOS applic
ConceptDraw DIAGRAM Compatibility with MS Visio

Bubble diagrams in Landscape Design with ConceptDraw DIAGRAM

Flow Chart Symbols

Examples of Flowcharts, Org Charts and More


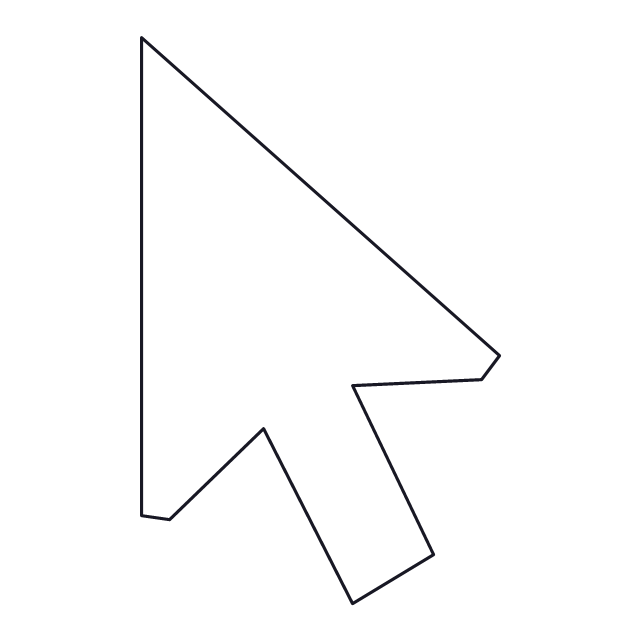
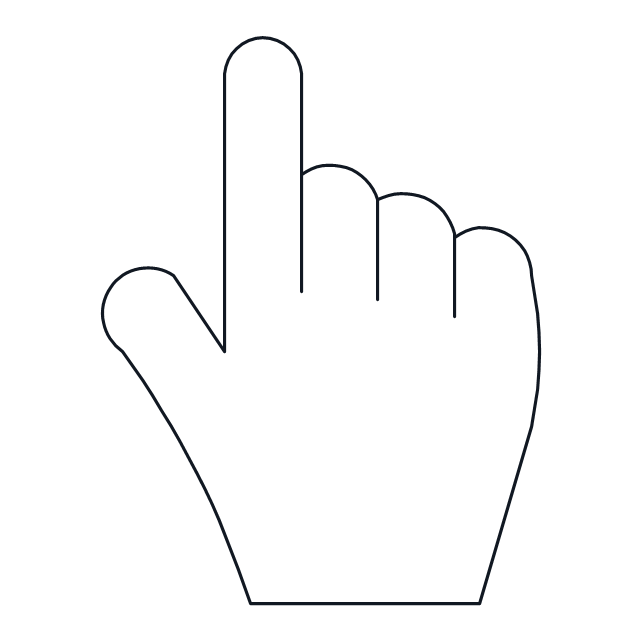
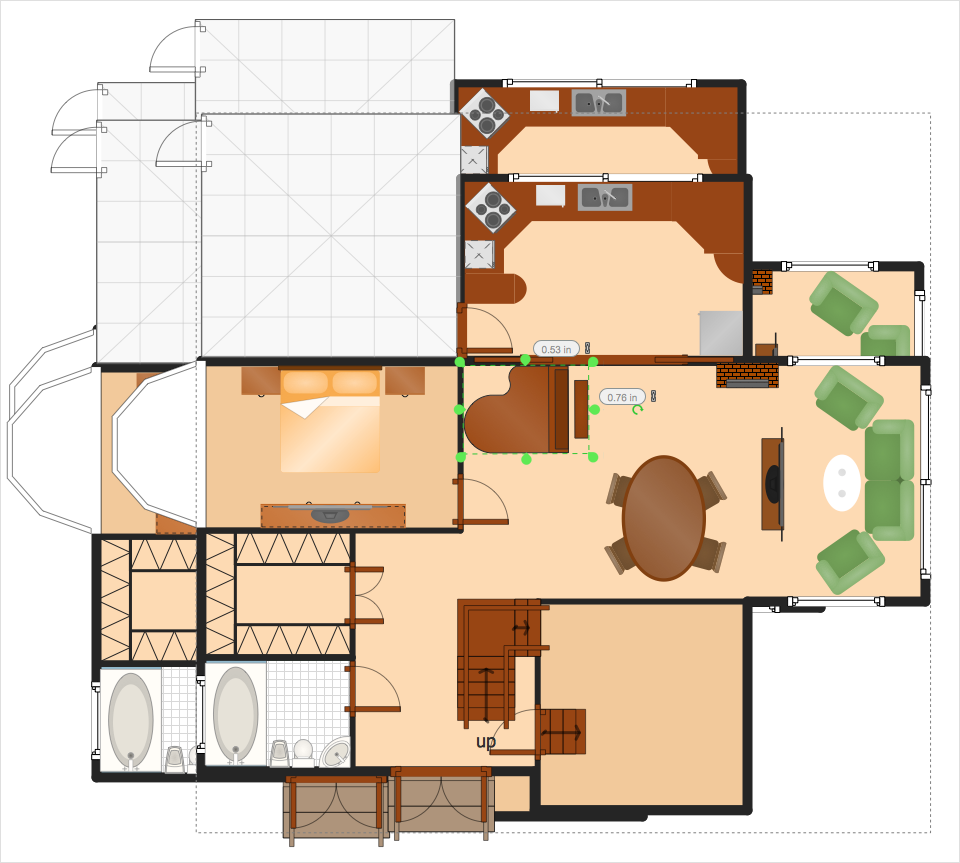
The vector stencils library "Interactions" contains 18 interaction elements icons: mouse pointers, splitters, select frame.
Use it to design graphic user interface (GUI) prototypes of your software applications for Windows 8.
"In computing, a pointer or mouse cursor (as part of a personal computer WIMP style of interaction) is a graphical image on the computer monitor or other display device. The pointer echoes movements of the pointing device, commonly a mouse or touchpad, and signals the point where actions of the user take place. It can be used to select and move other graphical user interface elements, and is distinct from the cursor, which responds to keyboard input. The cursor may also be repositioned using the pointer.
The pointer commonly appears as an angled arrow, (angled because historically that improved appearance on low resolution screens) but it can vary within different programs or operating systems. The use of a pointer is employed when the input method, or pointing device, is a device that can move fluidly across a screen and select or highlight objects on the screen." [Pointer (graphical user interfaces). Wikipedia]
The design elements example "Interactions - Vector stencils library" was created using the ConceptDraw PRO diagramming and vector drawing software extended with the Windows 8 User Interface solution from the Software Development area of ConceptDraw Solution Park.
Normal select pointer
Link select pointer
Text select pointer
Precision select pointer
Move pointer
Pan pointer
Vertical resize pointer
Horizontal resize pointer
Diagonal resize pointer
Diagonal resize pointer 2
Row resize pointer
Column resize pointer

Window splitter - vertically
Window splitter - horizontally
Working in background pointer

Busy pointer

Unavailable pointer

Normal select frame

The vector clipart library "Presentation design elements" contains 45 presentation symbols and arrows which you can easy use in your slides and illustrations.
"A presentation is the process of presenting a topic to an audience. It is typically a demonstration, lecture, or speech meant to inform, persuade, or build good will. ... the use of visuals reduced meeting times... audiences believe presenters who use visuals are more professional and credible than presenters who merely speak. ... meetings and presentations reinforced with visuals help participants reach decisions and consensus more quickly." [Presentation. Wikipedia]
The clip art example "Presentation design elements - Vector clipart library" was created in the ConceptDraw PRO diagramming and vector drawing software using the Presentation Clipart solution from the Illustration area of ConceptDraw Solution Park.
Advance Direction Sign

Circuit

Growth

Master Link

Comparison

Plus

Minus

Multiplication

Division

Loupe

Plus sign

Minus sign

Pros and Cons

Balance Lever

Balance

Scientific Research

Business People

Hand

Financial Growth

Wallet

Increase

Decrease

Clock

Mechanism

Interaction

Small Company

Big Company

Company Expansion

Foreign Market Entry

Time

Close Cooperation

Company

Company Merger

Company Extension

Foreign Market Penetration

Business Relations

Profits

Frame 1

Frame 2

Background 1

Background 2

Background 3

Background 4

Background 5

Title block

HelpDesk
How to Resize Objects
 Entity-Relationship Diagram (ERD)
An Entity-Relationship Diagram (ERD) is a visual presentation of entities and relationships. That type of diagrams is often used in the semi-structured or unstructured data in databases and information systems. At first glance ERD is similar to a flowch
Garrett IA Diagrams with ConceptDraw DIAGRAM

- Png Images For Background
- Background Vector Png
- Cool Circle Backgrounds Png
- Png Background
- Opposite Arrow Image
- Background Libarary Png Images
- Diagonal Arrow Black Background
- How to Add Different Backgrounds Within a Multipage Drawing
- Colorful Png Background
- Curved Arrow Png Images
- How to Connect an Image to a Topic in Your Mind Map | Arrows ...
- Corporate Hd Vector Backgrounds Png
- Gauge Image Png Sample Background
- Arrow Vector Image Png
- Png Background Designs
- Www Png Clipart Transparent Background
- Image Arrow For Presentation
- Two Sided Arrow Png
- Beautiful Arrow Png
- Triangle Image With Arrows