Entity Relationship Diagram Symbols

Sales Process Flowchart. Flowchart Examples

ERD Symbols and Meanings


 Sales Flowcharts
The Sales Flowcharts solution lets you create and display sales process maps, sales process workflows, sales steps, the sales process, and anything else involving sales process management.
Example of DFD for Online Store (Data Flow Diagram)


 Block Diagrams
Block diagrams solution extends ConceptDraw DIAGRAM software with templates, samples and libraries of vector stencils for drawing the block diagrams.
 Business Process Diagrams
Business Process Diagrams solution extends the ConceptDraw DIAGRAM BPM software with RapidDraw interface, templates, samples and numerous libraries based on the BPMN 1.2 and BPMN 2.0 standards, which give you the possibility to visualize equally easy simple and complex processes, to design business models, to quickly develop and document in details any business processes on the stages of project’s planning and implementation.
Entity-Relationship Diagram (ERD) with ConceptDraw DIAGRAM
 <br>with ConceptDraw DIAGRAM *")
 ATM UML Diagrams
The ATM UML Diagrams solution lets you create ATM solutions and UML examples. Use ConceptDraw DIAGRAM as a UML diagram creator to visualize a banking system.
 Flowcharts
The Flowcharts solution for ConceptDraw DIAGRAM is a comprehensive set of examples and samples in several varied color themes for professionals that need to represent graphically a process. Solution value is added by the basic flow chart template and shapes' libraries of flowchart notation. ConceptDraw DIAGRAM flow chart creator lets one depict the processes of any complexity and length, as well as design the Flowchart either vertically or horizontally.
 Logistics Flow Charts
Logistics Flow Charts solution extends ConceptDraw DIAGRAM functionality with opportunities of powerful logistics management software. It provides large collection of predesigned vector logistic symbols, pictograms, objects and clipart to help you design with pleasure Logistics flow chart, Logistics process flow diagram, Inventory flow chart, Warehouse flowchart, Warehouse management flow chart, Inventory control flowchart, or any other Logistics diagram. Use this solution for logistics planning, to reflect logistics activities and processes of an enterprise or firm, to depict the company's supply chains, to demonstrate the ways of enhancing the economic stability on the market, to realize logistics reforms and effective products' promotion.
 Rapid UML
Rapid UML solution extends ConceptDraw DIAGRAM software with templates, samples and libraries of vector stencils for quick drawing the UML diagrams using Rapid Draw technology.
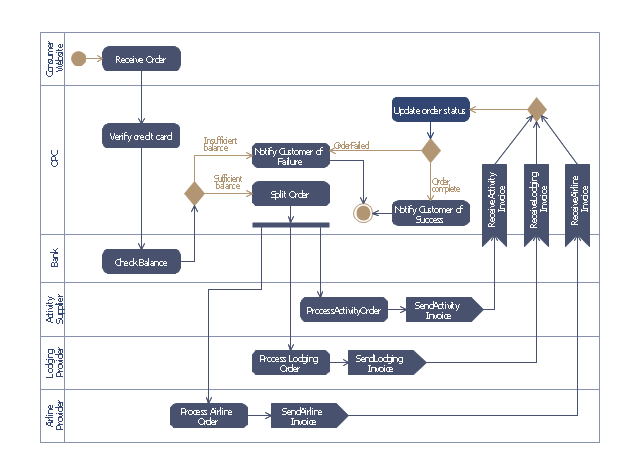
This purchase order processing UML activity diagram was created on the base of activity diagram from the software architecture documentation wiki of the Software Engineering Institute (SEI) of Carnegie Mellon University (CMU).
[wiki.sei.cmu.edu/ sad/ index.php/ Image:PurchaseOrderActivityDiagram.png]
"A purchase order (PO) is a commercial document and first official offer issued by a buyer to a seller, indicating types, quantities, and agreed prices for products or services. Acceptance of a purchase order by a seller forms a contract between the buyer and seller, so no contract exists until the purchase order is accepted. It is used to control the purchasing of products and services from external suppliers.
Creating a purchase order is typically the first step of the purchase to pay process in an ERP system." [Purchase order. Wikipedia]
This purchase order processing UML activity diagram example was created using the ConceptDraw PRO diagramming and vector drawing software extended with the ATM UML Diagrams solution from the Software Development area of ConceptDraw Solution Park.
UML activity diagram of purchase order processing
- Sales And Market Entity Relation
- Sales Process Flowchart. Flowchart Examples | Marketing and Sales ...
- Sales Growth. Bar Graphs Example | Sales Process Flowchart ...
- Accounting Flowchart Symbols | Flow Chart Symbols | Invoice ...
- Sales Flowcharts | Flowchart Example : Flow Chart of Marketing ...
- Invoice payment process - Flowchart | Flowchart For Payment ...
- Accounting Flowchart: Purchasing, Receiving, Payable and ...
- Entity - Relationship Diagram ( ERD ) | Order process - BPMN 2.0 ...
- Purchase order processing UML activity diagram | Order process ...
- Bank Sequence Diagram | UML use case diagram - Banking system ...
- Marketing Diagrams | Customer Journey Mapping | Ladder of ...
- Application handling and invoicing - Collaboration BPMN 2.0 ...
- Invoice payment process - Flowchart | Application handling and ...
- UML Activity Diagram | Diagramming Software for Design UML ...
- Invoice payment process - Flowchart | Accounting Flowchart ...
- Invoice payment process - Flowchart | Accounting Flowchart ...
- Purchase order processing UML activity diagram | UML interaction ...
- Invoice payment process - Flowchart | UML component diagram ...
- Transfer of risk from the seller to the buyer | UML composite structure ...
- UML activity diagram - Cash withdrawal from ATM | ATM UML ...