Percentage Pie Chart. Pie Chart Examples

This pie chart sample shows the atmosphere air composition. It was designed on the base of the Wikimedia Commons file: Air composition pie chart.JPG.
[commons.wikimedia.org/ wiki/ File:Air_ composition_ pie_ chart.JPG]
This file is licensed under the Creative Commons Attribution-Share Alike 3.0 Unported license. [creativecommons.org/ licenses/ by-sa/ 3.0/ deed.en]
"The atmosphere of Earth is a layer of gases surrounding the planet Earth that is retained by Earth's gravity. The atmosphere protects life on Earth by absorbing ultraviolet solar radiation, warming the surface through heat retention (greenhouse effect), and reducing temperature extremes between day and night (the diurnal temperature variation).
The common name given to the atmospheric gases used in breathing and photosynthesis is air. By volume, dry air contains 78.09% nitrogen, 20.95% oxygen, 0.93% argon, 0.039% carbon dioxide, and small amounts of other gases. Air also contains a variable amount of water vapor, on average around 1%. Although air content and atmospheric pressure vary at different layers, air suitable for the survival of terrestrial plants and terrestrial animals currently is only known to be found in Earth's troposphere and artificial atmospheres." [Atmosphere of Earth. Wikipedia]
The pie chart example "Atmosphere air composition" was created using the ConceptDraw PRO diagramming and vector drawing software extended with the Pie Charts solution of the Graphs and Charts area in ConceptDraw Solution Park.
Pie chart

Export from ConceptDraw MINDMAP to PowerPoint® Presentation


to MS PowerPoint
Pie Graph Worksheets

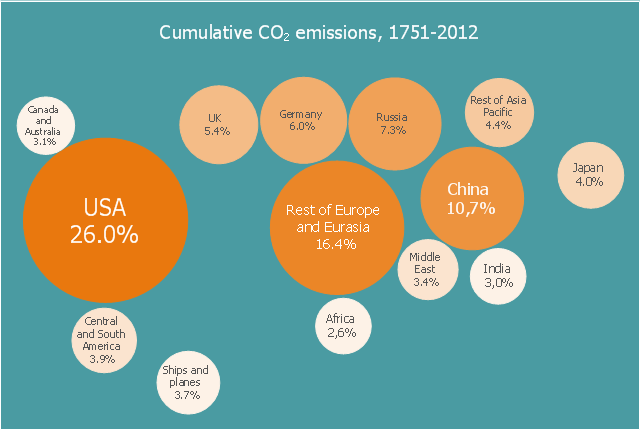
This bubble diagram sample shows the percentage share of global cumulative energy-related carbon dioxide emissions between 1751 and 2012 across different regions. It was designed on the base of the Wikimedia Commons file: Percentage share of global cumulative energy-related carbon dioxide emissions between 1751 and 2012 across different regions-es.svg.
[commons.wikimedia.org/ wiki/ File:Percentage_ share_ of_ global_ cumulative_ energy-related_ carbon_ dioxide_ emissions_ between_ 1751_ and_ 2012_ across_ different_ regions-es.svg]
This file is licensed under the Creative Commons Attribution-Share Alike 4.0 International license. [creativecommons.org/ licenses/ by-sa/ 4.0/ deed.en]
"Carbon dioxide (CO2) is an important trace gas in Earth's atmosphere currently constituting about 0.04%, i.e. 400 parts per million (ppm), of the atmosphere. Despite its relatively small concentration, CO2 is a potent greenhouse gas and plays a vital role in regulating Earth's surface temperature through radiative forcing and the greenhouse effect." [Carbon dioxide in Earth's atmosphere. Wikipedia]
The bubble diagram example "Cumulative CO2 emissions, 1751-2012" was created using the ConceptDraw DIAGRAM diagramming and vector drawing software extended with Business Diagrams solution from Management area of ConceptDraw Solution Park.
Bubble diagram
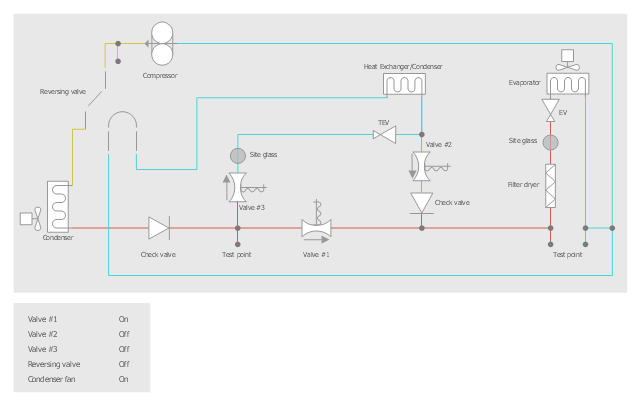
This HVAC schematics sample depicts the house cool mode of central air pool heater. It was drawn on the base of the HVAC schematics in the post "Central Air Pool Heater" from the Nathan Stratton's blog.
"With House Cool Mode, hot gas leaves the compressor runs through the reversing value into the condenser where it condenses into a liquid. Valve #1 is ON so liquid is able to leave the outside unit and run through the filter dryer and site glass into the evaporator upstairs in the house where the liquid flashes into a gas as it passes through the expansion valve and absorbs heat from the air passing through the evaporator. The cold gas travels downstairs and outside to the compressor and the cycle starts all over again." [robotics.net/ projects/ central-air-pool-heater/ ]
The HVAC schematics example "Central air pool heater" was created using the ConceptDraw DIAGRAM diagramming and vector drawing software extended with the HVAC Plans solution from the Building Plans area of ConceptDraw Solution Park.
HVAC schematics
Donut Chart

Pie Donut Chart. Pie Chart Examples

Pie Chart Examples and Templates

Swim Lane Diagrams

- Percentage Pie Chart. Pie Chart Examples | Atmosphere air ...
- Atmosphere air composition | Percentage Pie Chart. Pie Chart ...
- Draw A Pie Chart Showing Different Gases And Their Percentage In
- Atmosphere air composition | Percentage Pie Chart. Pie Chart ...
- Atmosphere air composition | Percentage Pie Chart. Pie Chart ...
- Atmosphere air composition | Percentage Pie Chart. Pie Chart ...
- Percentage Pie Chart. Pie Chart Examples | Atmosphere air ...
- Percentage Of Gases Present In Air
- Approximate composition of the air - Pie chart | Pia Chart Of Atmos ...