This pie chart sample shows the atmosphere air composition. It was designed on the base of the Wikimedia Commons file: Air composition pie chart.JPG.
[commons.wikimedia.org/ wiki/ File:Air_ composition_ pie_ chart.JPG]
This file is licensed under the Creative Commons Attribution-Share Alike 3.0 Unported license. [creativecommons.org/ licenses/ by-sa/ 3.0/ deed.en]
"The atmosphere of Earth is a layer of gases surrounding the planet Earth that is retained by Earth's gravity. The atmosphere protects life on Earth by absorbing ultraviolet solar radiation, warming the surface through heat retention (greenhouse effect), and reducing temperature extremes between day and night (the diurnal temperature variation).
The common name given to the atmospheric gases used in breathing and photosynthesis is air. By volume, dry air contains 78.09% nitrogen, 20.95% oxygen, 0.93% argon, 0.039% carbon dioxide, and small amounts of other gases. Air also contains a variable amount of water vapor, on average around 1%. Although air content and atmospheric pressure vary at different layers, air suitable for the survival of terrestrial plants and terrestrial animals currently is only known to be found in Earth's troposphere and artificial atmospheres." [Atmosphere of Earth. Wikipedia]
The pie chart example "Atmosphere air composition" was created using the ConceptDraw PRO diagramming and vector drawing software extended with the Pie Charts solution of the Graphs and Charts area in ConceptDraw Solution Park.
Pie chart

The vector stencils library "Weather" contains 17 weather clipart images for drawing illustrations on climate to show cloudiness, air temperature, precipitation, wind.
"Weather is the state of the atmosphere, to the degree that it is hot or cold, wet or dry, calm or stormy, clear or cloudy. Most weather phenomena occur in the troposphere, just below the stratosphere. Weather generally refers to day-to-day temperature and precipitation activity, whereas climate is the term for the average atmospheric conditions over longer periods of time. When used without qualification, "weather", is generally understood to mean the weather of Earth.
Weather is driven by air pressure (temperature and moisture) differences between one place and another. These pressure and temperature differences can occur due to the sun angle at any particular spot, which varies by latitude from the tropics. The strong temperature contrast between polar and tropical air gives rise to the jet stream. Weather systems in the mid-latitudes, such as extratropical cyclones, are caused by instabilities of the jet stream flow. Because the Earth's axis is tilted relative to its orbital plane, sunlight is incident at different angles at different times of the year. On Earth's surface, temperatures usually range ±40°C (−40°F to 100°F) annually. Over thousands of years, changes in Earth's orbit affect the amount and distribution of solar energy received by the Earth and influence long-term climate and global climate change." [Weather. Wikipedia]
The clip art example "Weather - Vector stencils library" was created using the ConceptDraw PRO diagramming and vector drawing software extended with the Nature solution from the Illustration area of ConceptDraw Solution Park.
www.conceptdraw.com/ solution-park/ illustrations-nature
Sunny

Cloudy

Overcast

Snow

Rain

Lightning

Hot

Warm

Frost

Mist

Strong wind

Flood

Tsunami

Dew

Hoar-frost

Earthquake

Snowflake

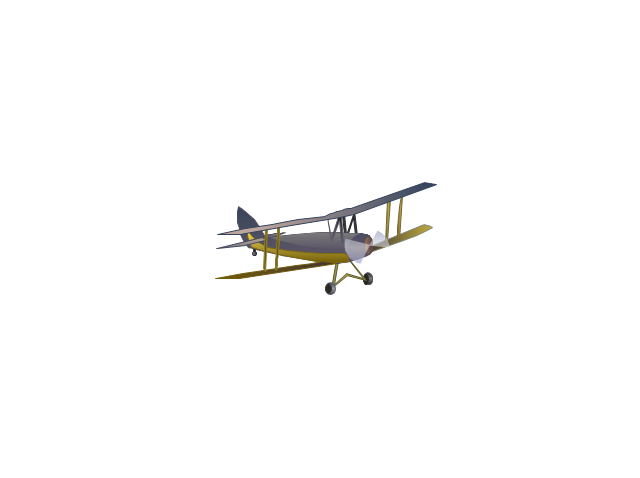
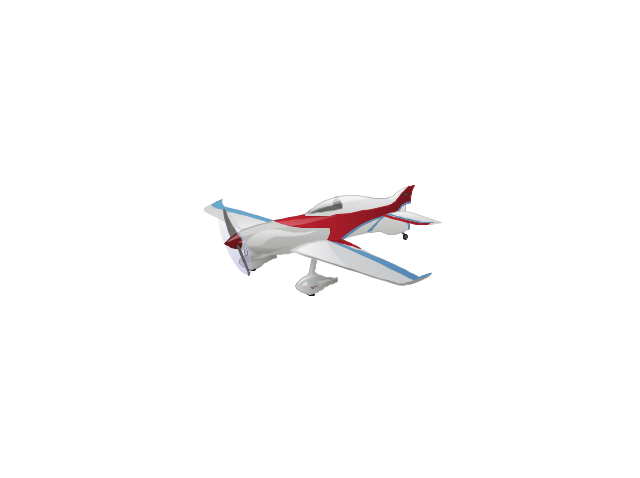
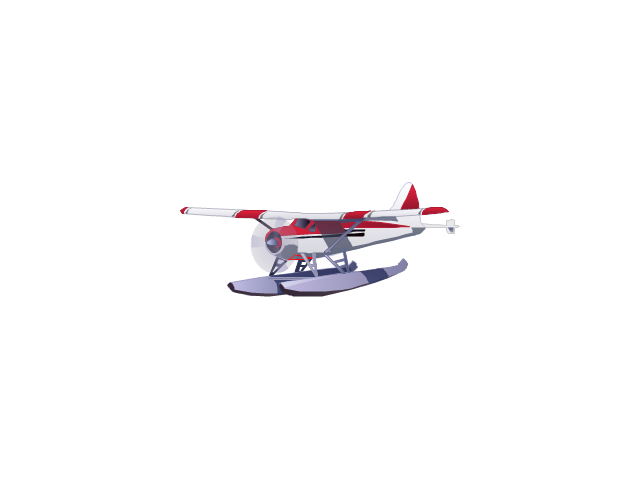
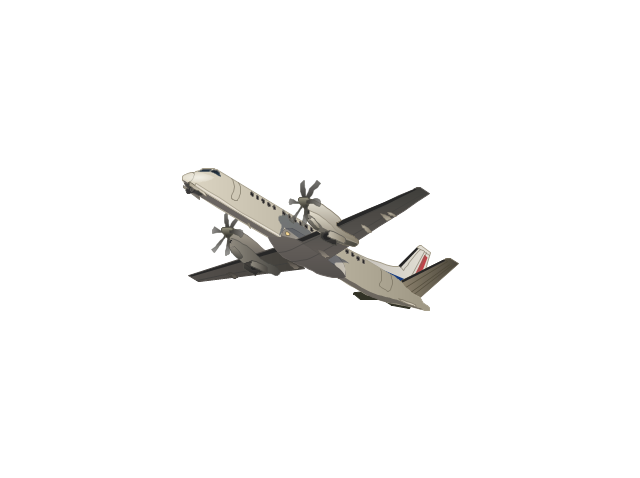
The vector stencils library "Aircraft" contains 19 clip art images for creating aviation illustrations, presentation slides, infographics and webpages using the ConceptDraw PRO diagramming and vector drawing software.
"An aircraft is a machine that is able to fly by gaining support from the air, or, in general, the atmosphere of a planet. It counters the force of gravity by using either static lift or by using the dynamic lift of an airfoil, or in a few cases the downward thrust from jet engines.
The human activity that surrounds aircraft is called aviation. Crewed aircraft are flown by an onboard pilot, but unmanned aerial vehicles may be remotely controlled or self-controlled by onboard computers. Aircraft may be classified by different criteria, such as lift type, propulsion, usage and others." [Aircraft. Wikipedia]
The vector stencils library "Aircraft" is included in the Aerospace and Transport solution from the Illustrations area of ConceptDraw Solution Park.
www.conceptdraw.com/ solution-park/ illustrations-aerospace-transport
Biplane
Sporting airplane
Hydroplane
Aircraft turboprops
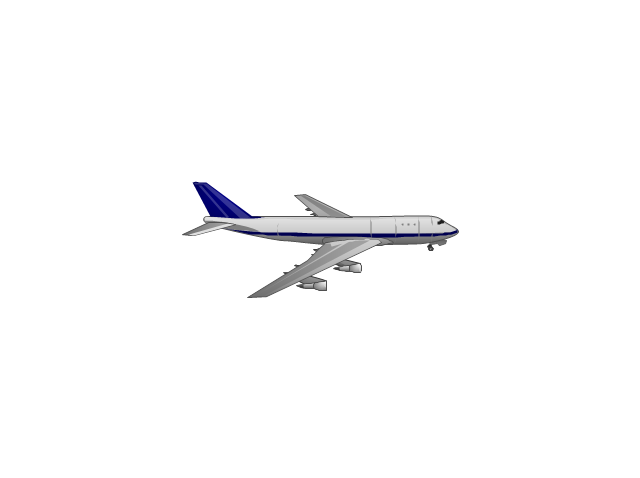
Cargo airplane
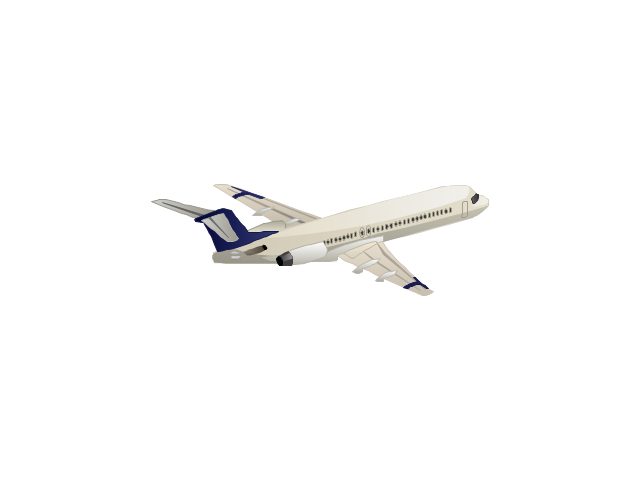
Passenger airplane
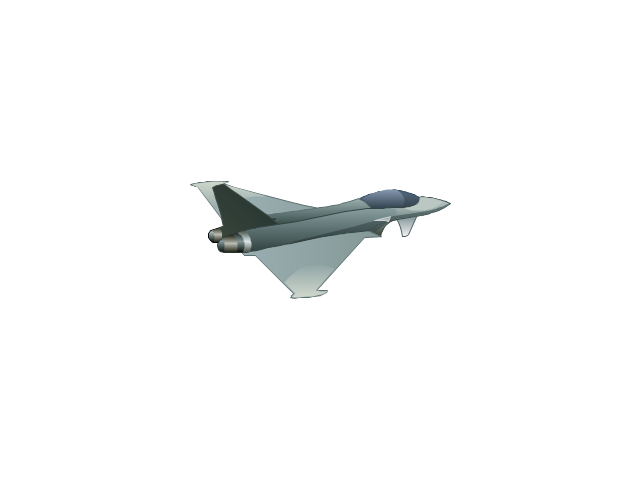
Fighter plane
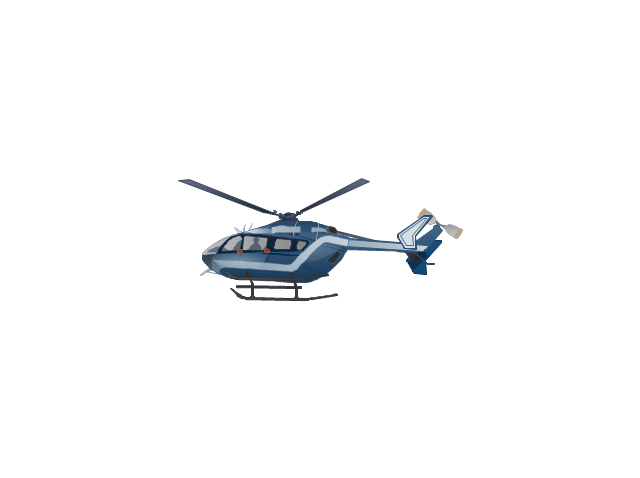
Helicopter
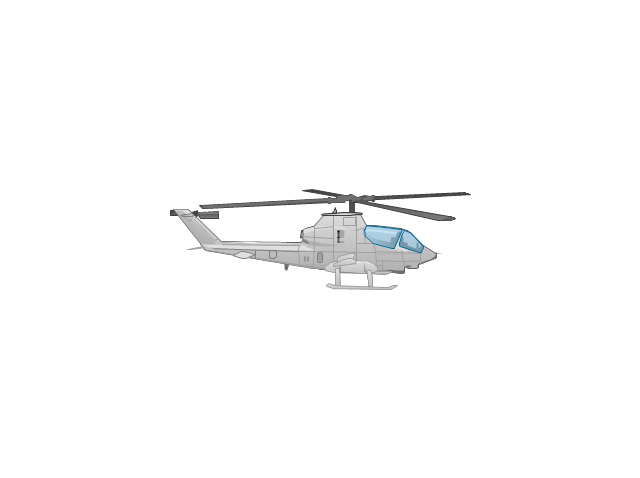
Small helicopter
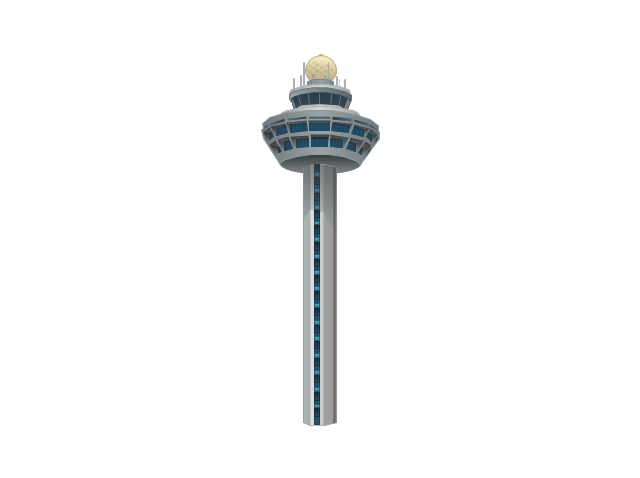
Airport control tower
Radar screen
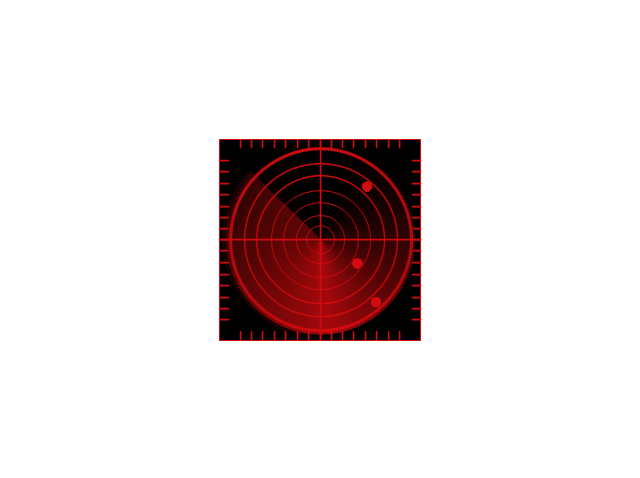
Radar screen

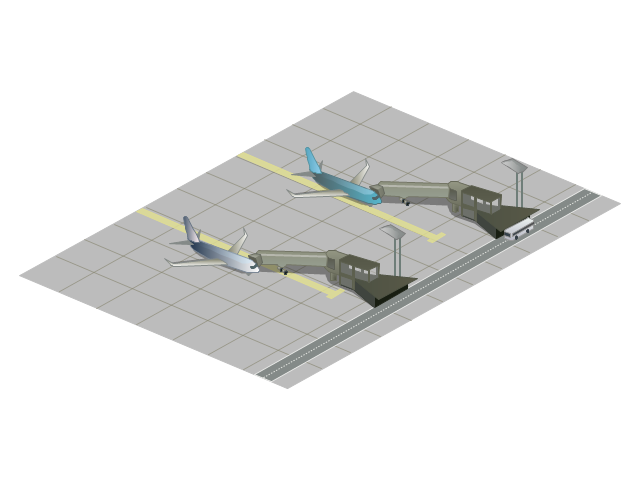
Airport terminals
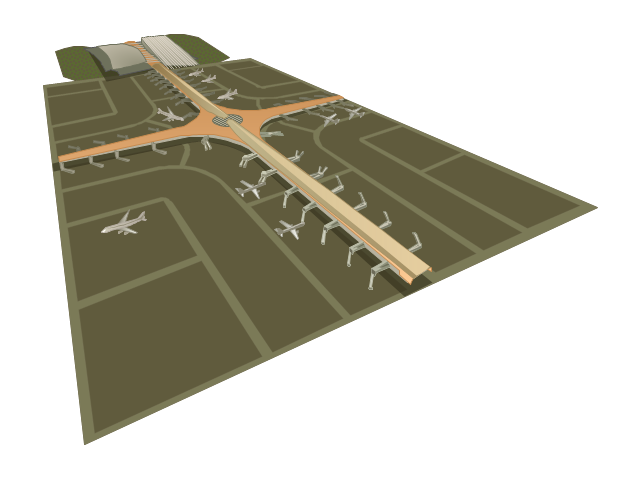
Tarmacs
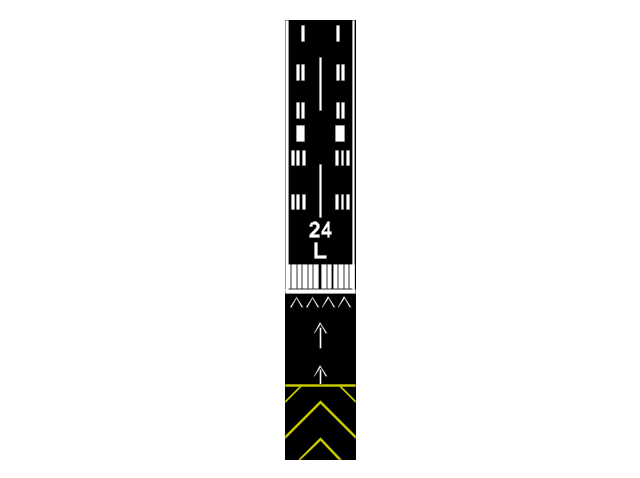
Runway
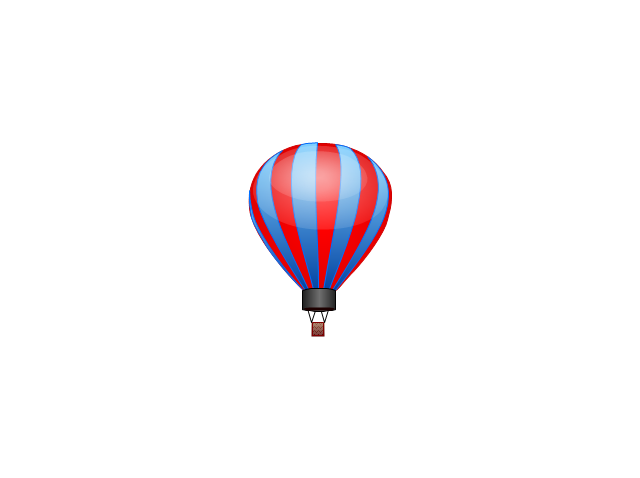
Balloon
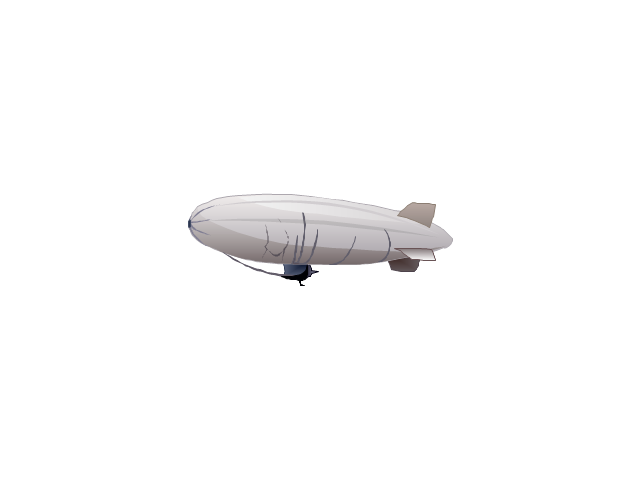
Dirigible
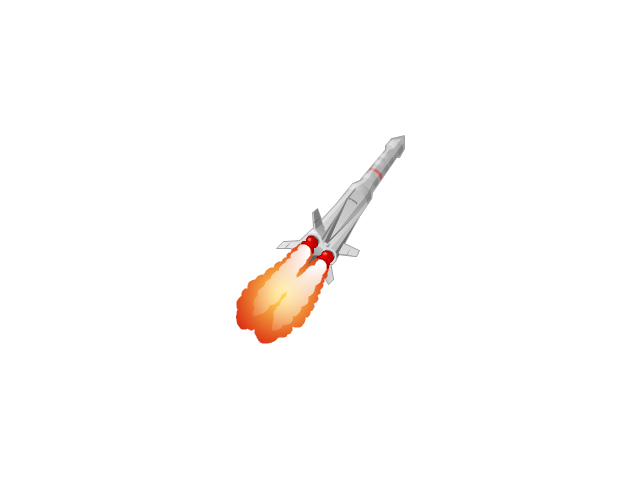
Rocket
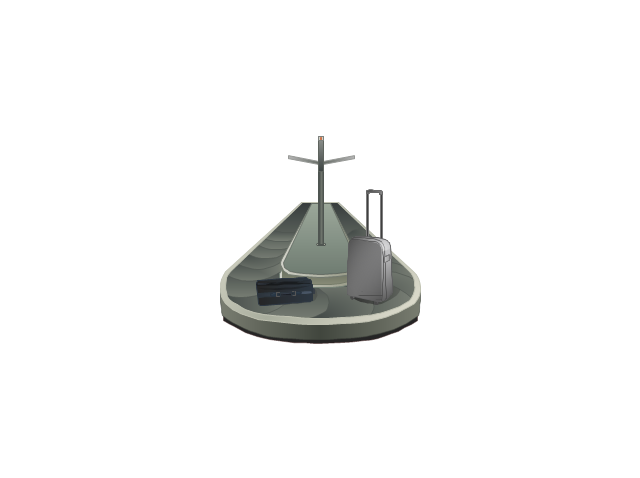
Baggage conveyor
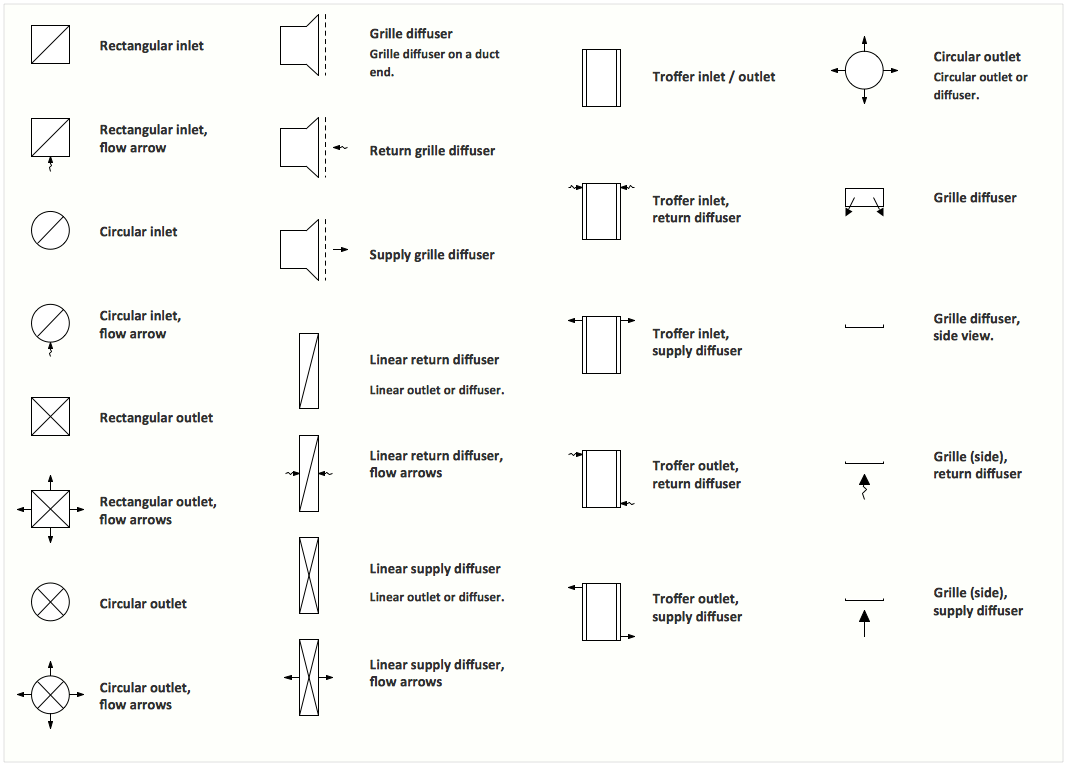
Interior Design. Registers, Drills and Diffusers — Design Elements
This work flow chart sample was redesigned from the picture "Weather Forecast" from the article "Simulation Workflows".
[iaas.uni-stuttgart.de/ forschung/ projects/ simtech/ sim-workflows.php]
"(1) The weather is predicted for a particular geological area. Hence, the workflow is fed with a model of the geophysical environment of ground, air and water for a requested area.
(2) Over a specified period of time (e.g. 6 hours) several different variables are measured and observed. Ground stations, ships, airplanes, weather balloons, satellites and buoys measure the air pressure, air/ water temperature, wind velocity, air humidity, vertical temperature profiles, cloud velocity, rain fall, and more.
(3) This data needs to be collected from the different sources and stored for later access.
(4) The collected data is analyzed and transformed into a common format (e.g. Fahrenheit to Celsius scale). The normalized values are used to create the current state of the atmosphere.
(5) Then, a numerical weather forecast is made based on mathematical-physical models (e.g. GFS - Global Forecast System, UKMO - United Kingdom MOdel, GME - global model of Deutscher Wetterdienst). The environmental area needs to be discretized beforehand using grid cells. The physical parameters measured in Step 2 are exposed in 3D space as timely function. This leads to a system of partial differential equations reflecting the physical relations that is solved numerically.
(6) The results of the numerical models are complemented with a statistical interpretation (e.g. with MOS - Model-Output-Statistics). That means the forecast result of the numerical models is compared to statistical weather data. Known forecast failures are corrected.
(7) The numerical post-processing is done with DMO (Direct Model Output): the numerical results are interpolated for specific geological locations.
(8) Additionally, a statistical post-processing step removes failures of measuring devices (e.g. using KALMAN filters).
(9) The statistical interpretation and the numerical results are then observed and interpreted by meteorologists based on their subjective experiences.
(10) Finally, the weather forecast is visualized and presented to interested people." [iaas.uni-stuttgart.de/ forschung/ projects/ simtech/ sim-workflows.php]
The example "Workflow diagram - Weather forecast" was drawn using the ConceptDraw PRO diagramming and vector drawing software extended with the Workflow Diagrams solution from the Business Processes area of ConceptDraw Solution Park.
Work flow chart

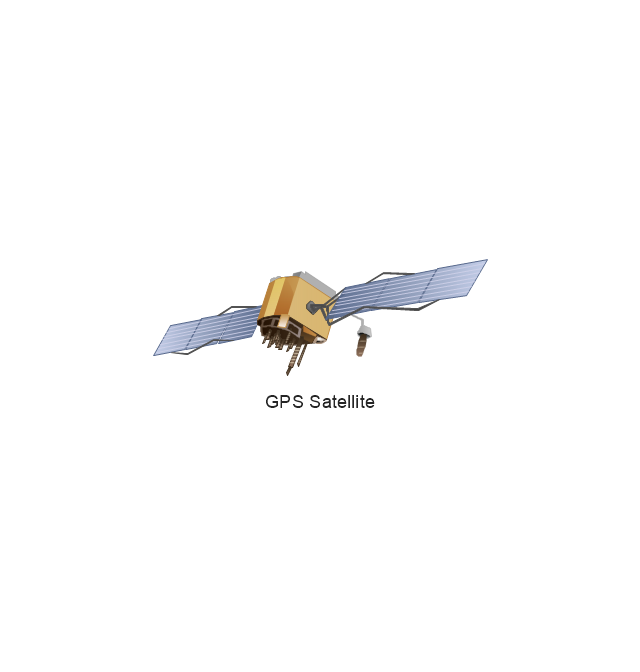
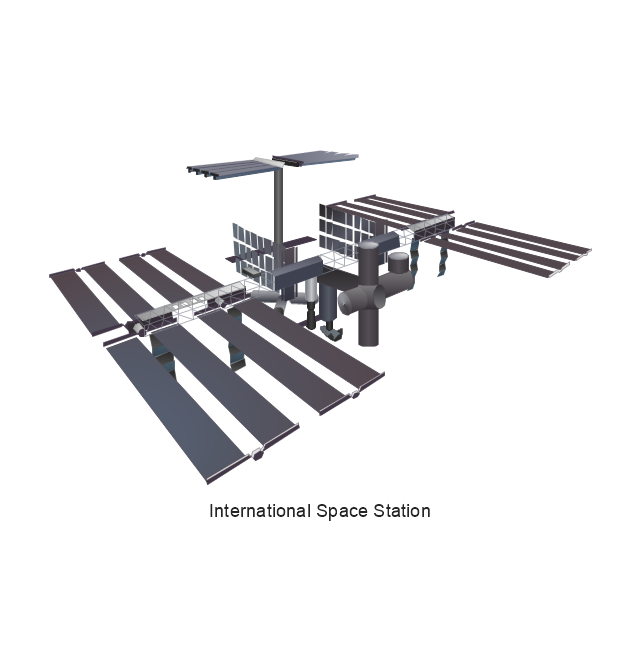
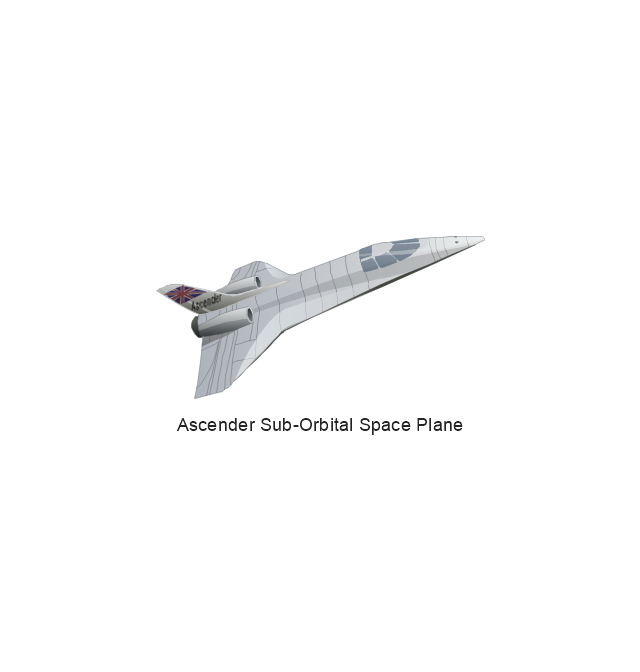
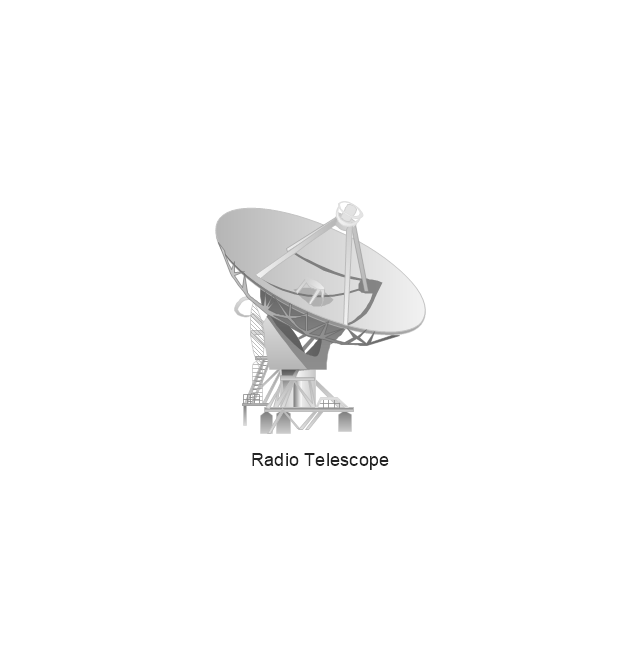
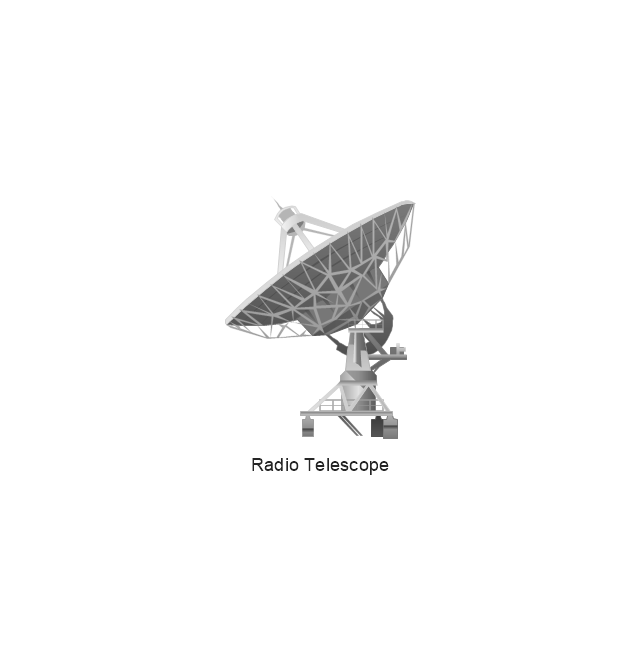
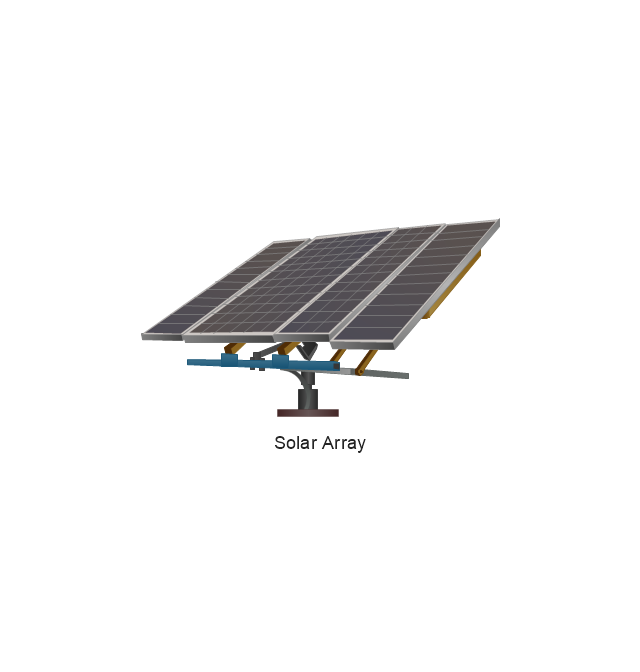
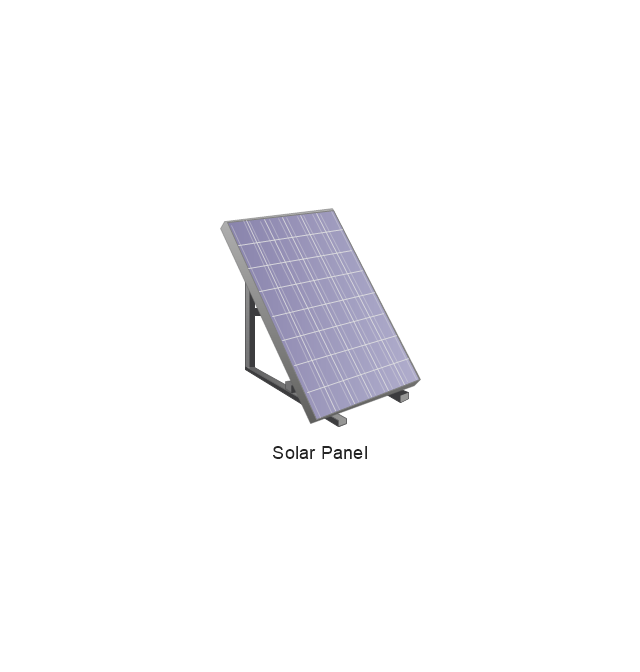
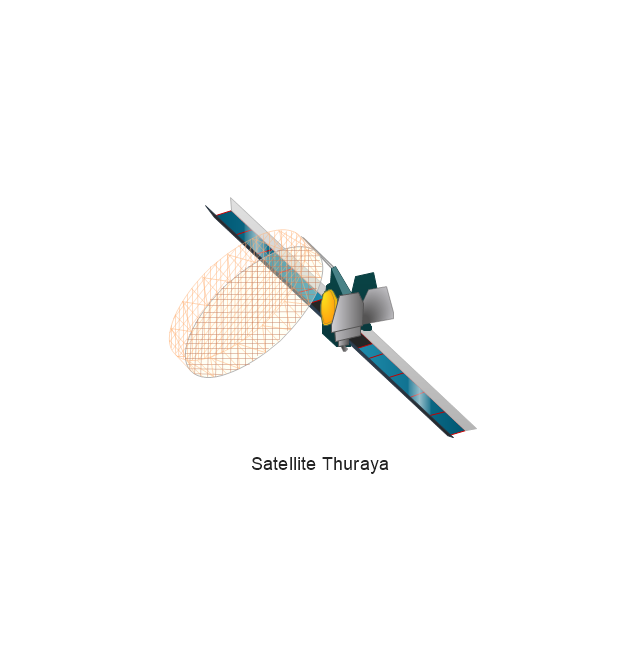
The vector stencils library "Aerospace" contains 38 clip art images for creating aerospace illustrations, presentation slides, infographics and webpages using the ConceptDraw PRO diagramming and vector drawing software.
"Aerospace describes the human effort in science, engineering and business to fly in the atmosphere of Earth (aeronautics) and surrounding space (astronautics). Aerospace organisations research, design, manufacture, operate, or maintain aircraft and/ or spacecraft. Aerospace activity is very diverse, with a multitude of commercial, industrial and military applications.
Aerospace is not the same as airspace, which is the physical air space directly above a location on the ground." [Aerospace. Wikipedia]
The vector stencils library "Aerospace" is included in the Aerospace and Transport solution from the Illustrations area of ConceptDraw Solution Park.
www.conceptdraw.com/ solution-park/ illustrations-aerospace-transport
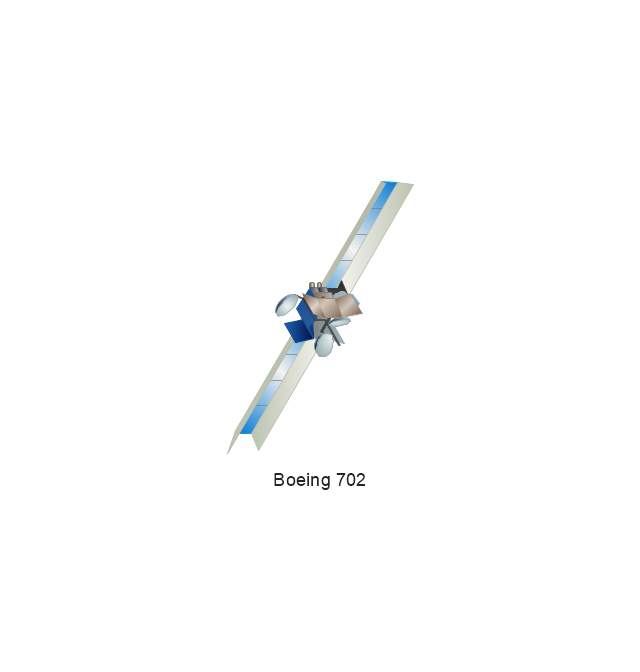
Boeing 702
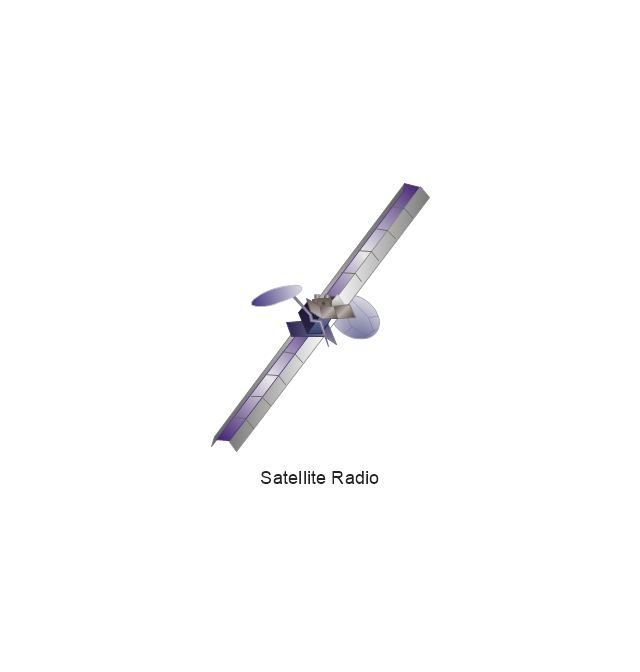
Satellite Radio
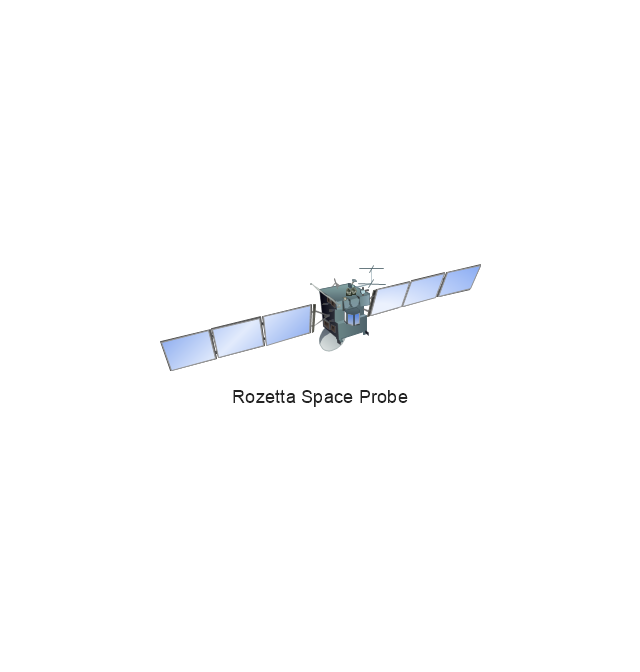
Rosetta Space Probe
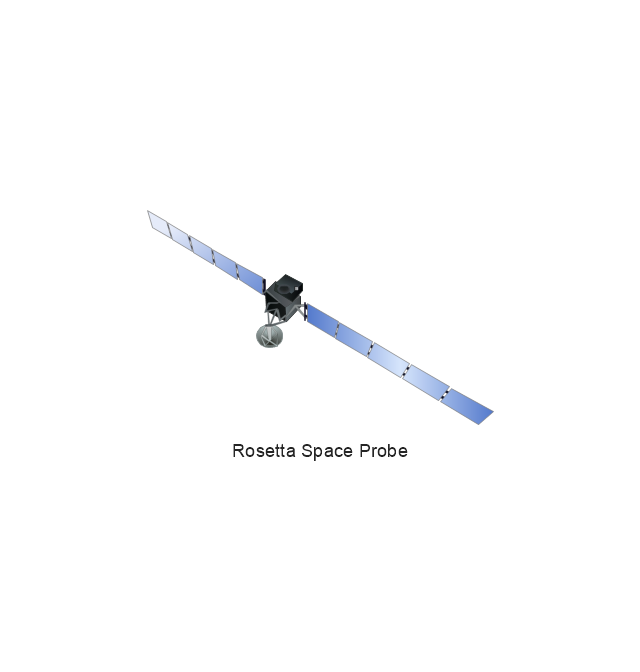
Rosetta Space Probe
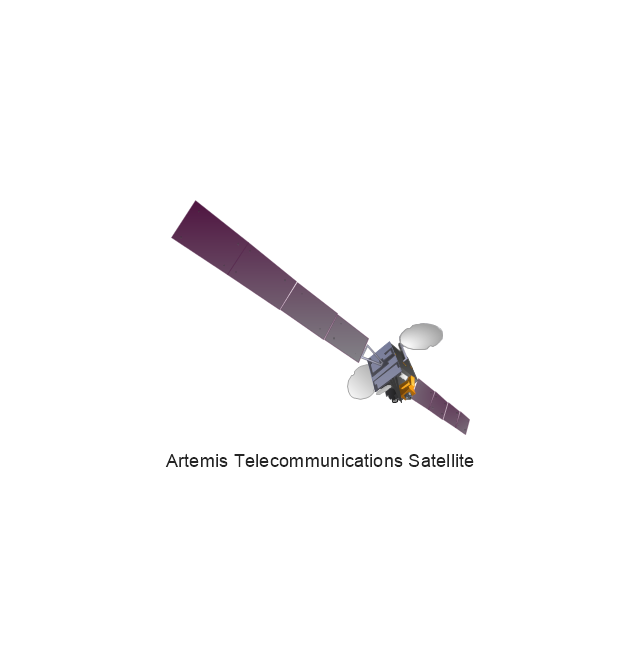
Artemis Telecommunications Satellite
GPS Satellite
International Space Station
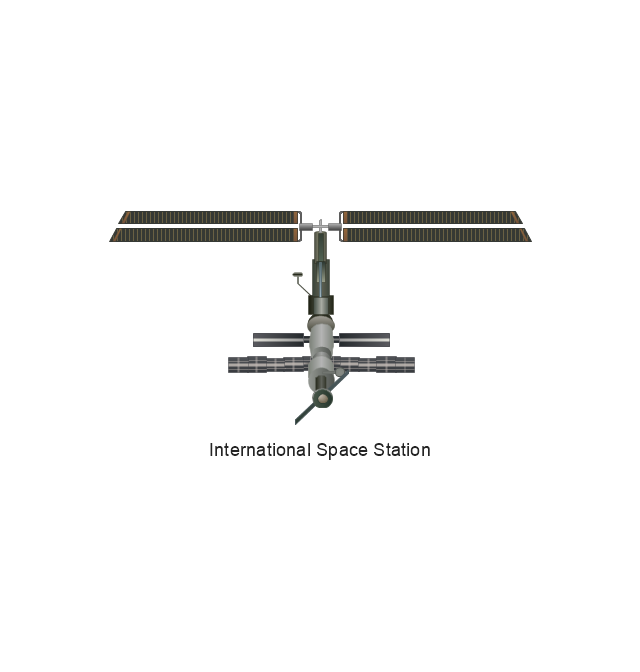
International Space Station
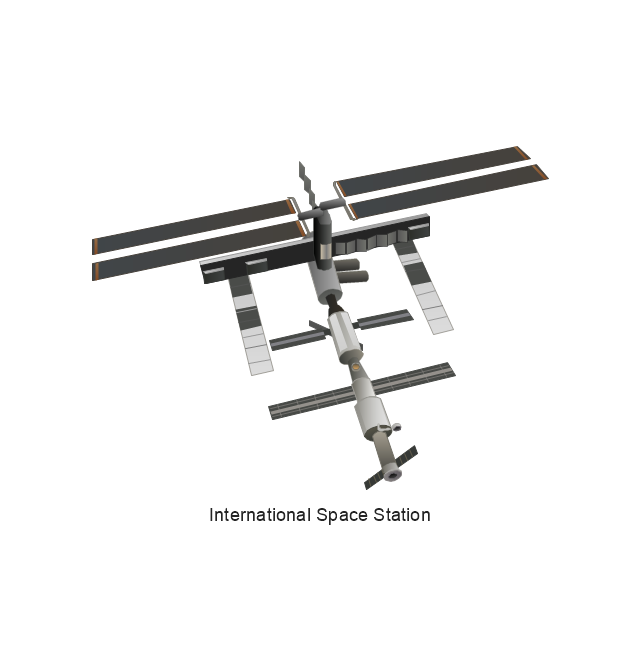
International Space Station
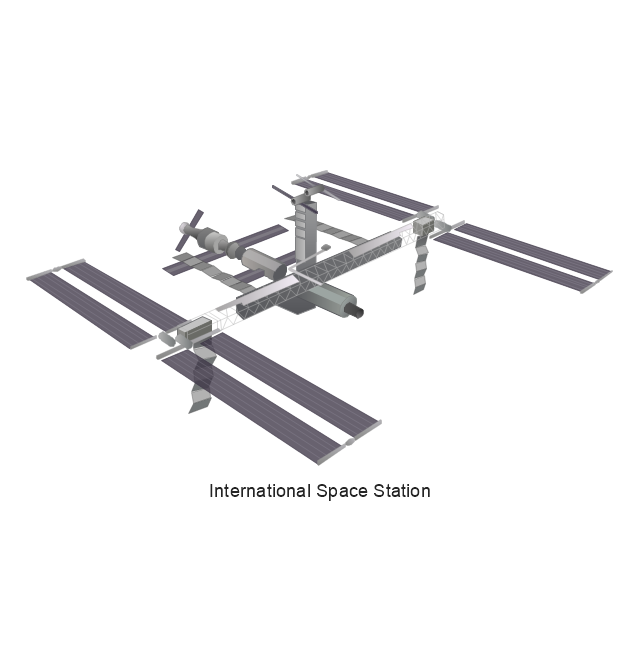
International Space Station
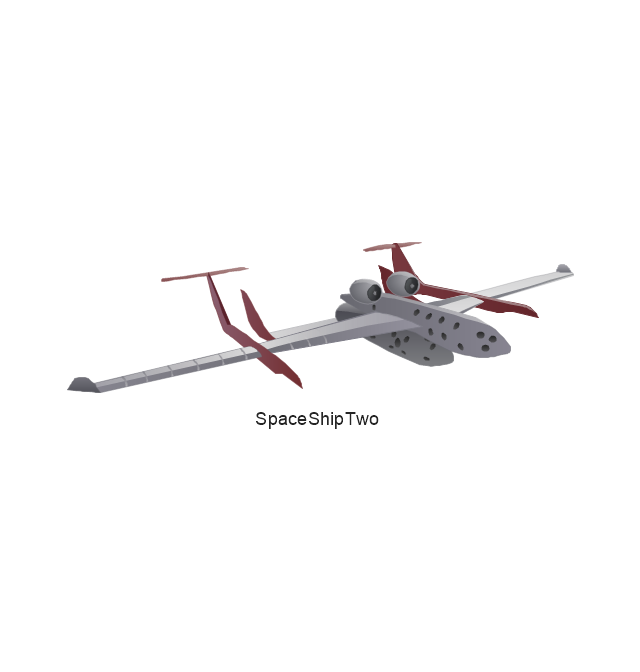
SpaceShipTwo
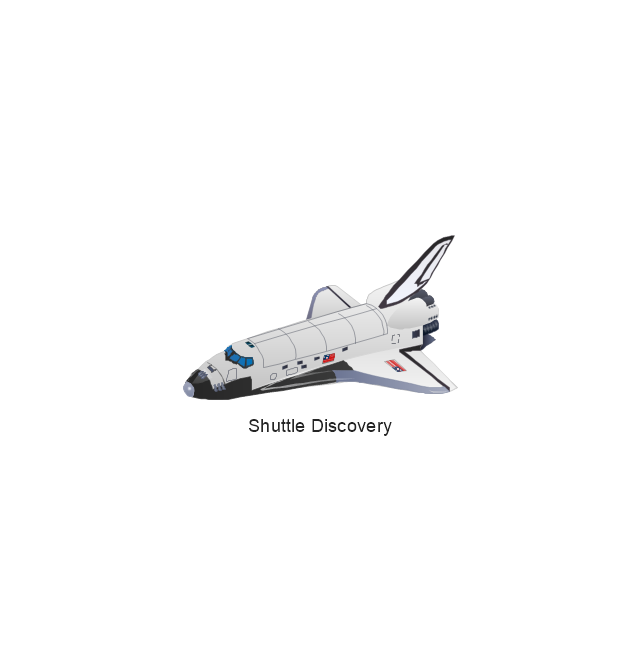
Shuttle Discovery
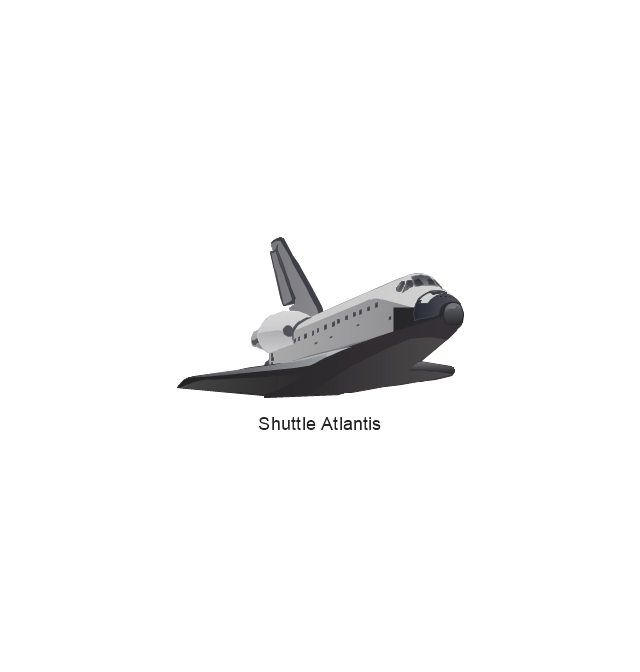
Shuttle Atlantis
Ascender Sub-Orbital Space Plane
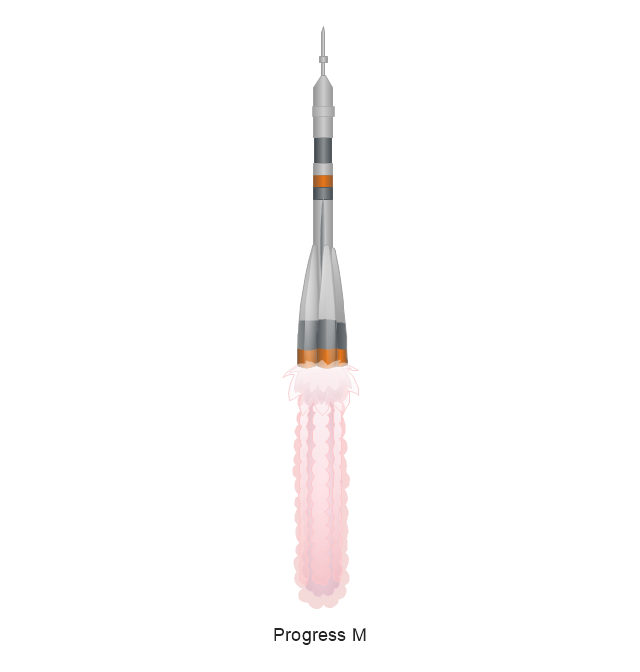
Progress M
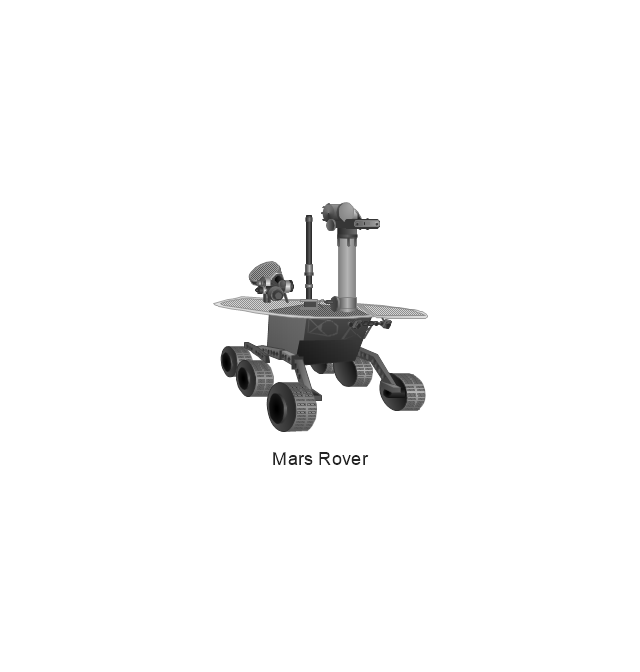
Mars Rover
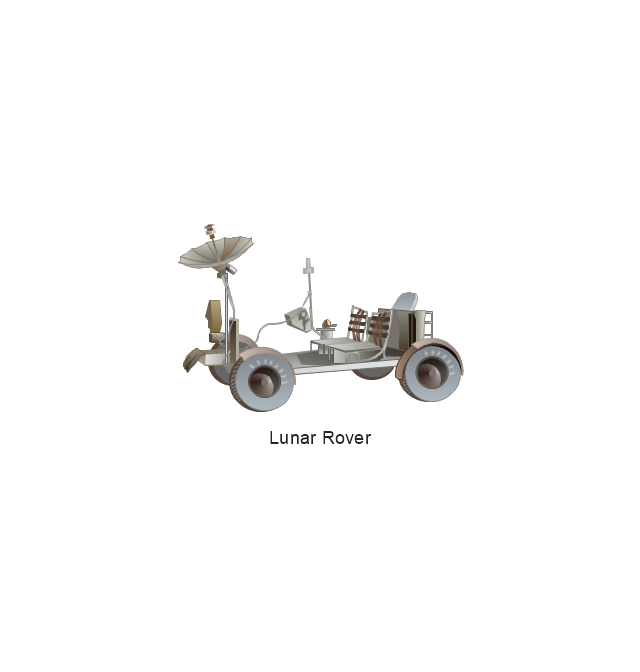
Lunar Rover
Radio Telescope
Radio Telescope
Solar Array
Solar Panel
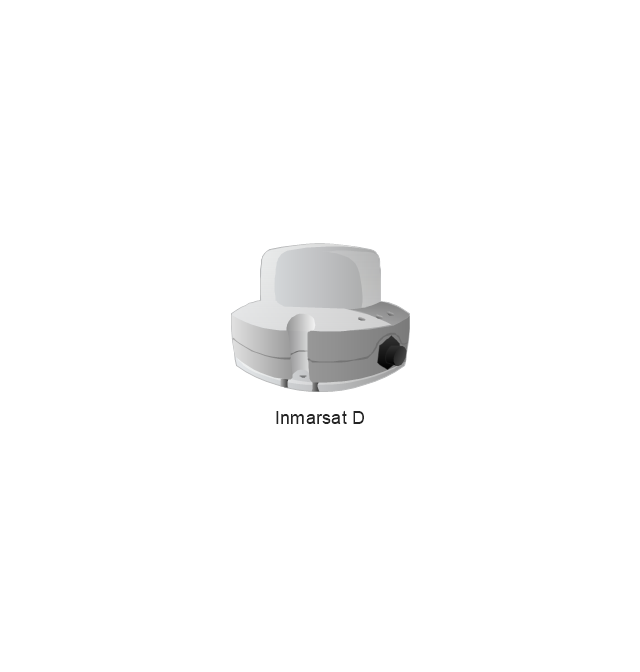
Inmarsat D
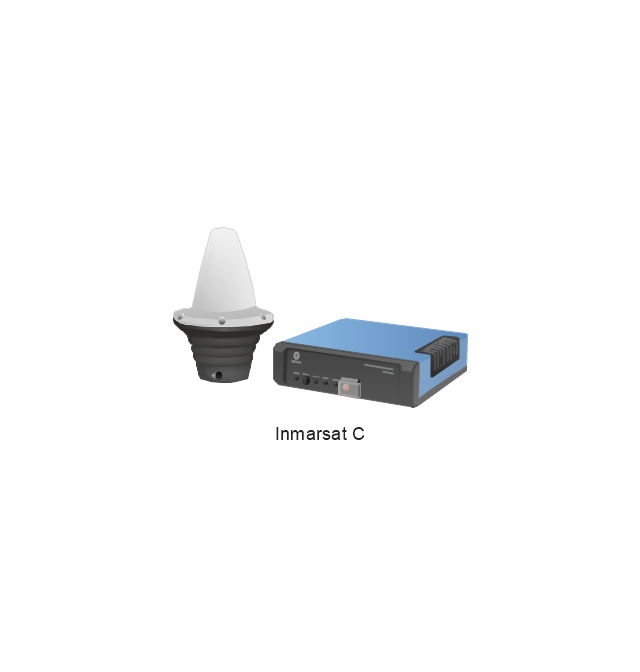
Inmarsat C
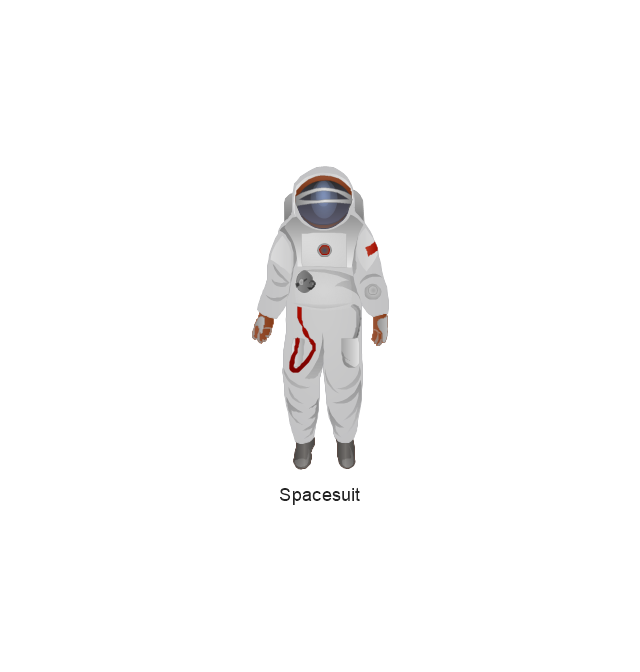
Spacesuit
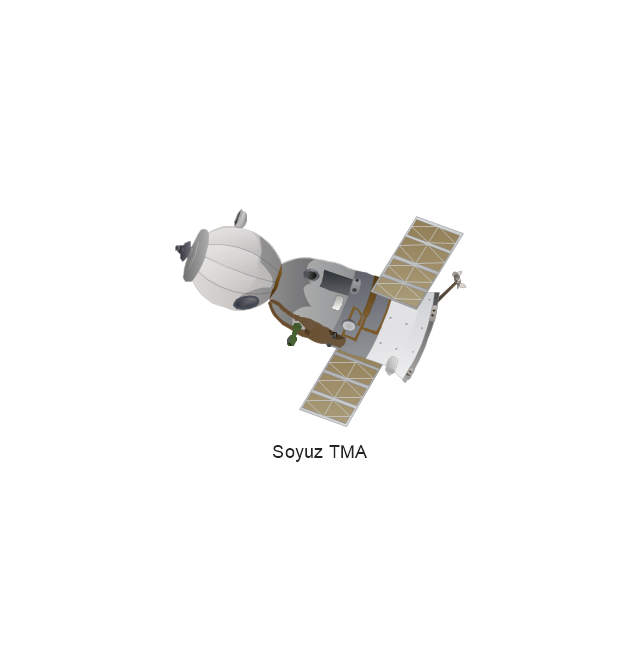
Soyuz TMA
Satellite Thuraya
Tracking Headquarters
Earth
Earth
Earth
Earth
Moon
Galaxy
Galaxy
Galaxy
Astronaut/Cosmonaut
Tracking Headquarters
Night Sky

Pie Chart Examples and Templates

Percentage Pie Chart. Pie Chart Examples

Interior Design. Office Layout Plan Design Element


Organizational Chart Templates


Swim Lane Diagrams

- Atmosphere air composition | Percentage Pie Chart. Pie Chart ...
- Atmosphere air composition | Pie Chart Examples and Templates ...
- Atmosphere air composition | Pie Graph Of Atmosphere Gases
- Atmosphere air composition | CERES data flow diagram ...
- Atmosphere air composition | Atmosphere air composition ...
- Atmosphere air composition | Design elements - Composition charts ...
- Percentage Pie Chart. Pie Chart Examples | Atmosphere air ...
- Atmosphere air composition | Swim Lane Diagrams | Pie Chart Of ...
- Atmosphere air composition | Composition Of Air By Volume In Pie ...
- Atmosphere air composition | Pie Charts | Percentage Pie Chart. Pie ...
- Atmosphere air composition | Process Flowchart | Pie Chart About ...
- Atmosphere air composition | Air handler- HVAC plan | Central air ...
- Atmosphere air composition | Aerospace and Transport | Gas ...
- Atmosphere air composition | Interior Design Seating Plan - Design ...
- Atmosphere air composition | LLNL Flow Charts | Cross-Functional ...
- Pie Chart Showing Composition Of Air In The Atmosphere
- Atmosphere air composition | Draw A Pie Chart Of Greenhouse Gases
- Atmosphere air composition | Pie Chart That Represent The Gasses ...
- Atmosphere air composition | The Pie Chart Of Gasses That ...
- Atmosphere air composition | Bar Diagrams for Problem Solving ...