 SYSML
SYSML
The SysML solution helps to present diagrams using Systems Modeling Language; a perfect tool for system engineering.
Process Flowchart


 Flowcharts
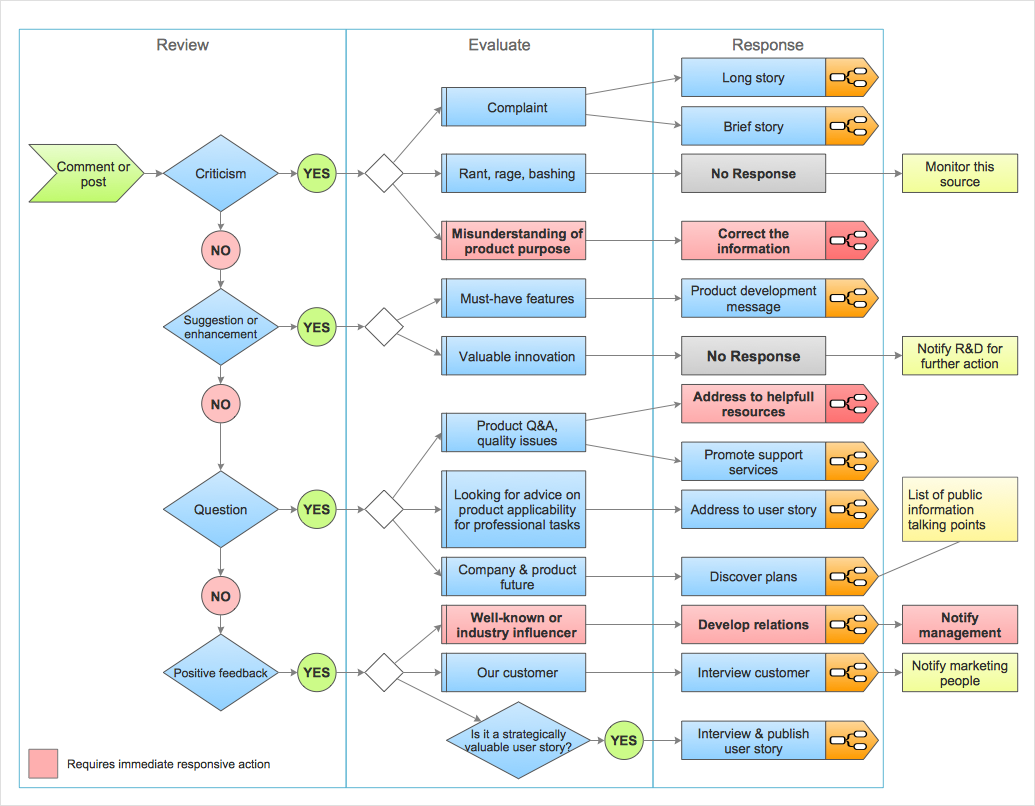
The Flowcharts solution for ConceptDraw PRO is a comprehensive set of examples and samples in several varied color themes for professionals that need to represent graphically a process. Solution value is added by the basic flow chart template and shapes' libraries of flowchart notation. ConceptDraw PRO flow chart creator lets one depict the processes of any complexity and length, as well as design the Flowchart either vertically or horizontally.
Network Glossary Definition


ConceptDraw PRO Network Diagram Tool


 Status Dashboard
Status dashboard solution extends ConceptDraw PRO software with templates, samples and vector stencils libraries with graphic indicators for drawing the visual dashboards showing status data.
 Entity-Relationship Diagram (ERD)
Entity-Relationship Diagram (ERD) solution extends ConceptDraw PRO software with templates, samples and libraries of vector stencils from drawing the ER-diagrams by Chen's and crow’s foot notations.
 Security and Access Plans
This solution extends ConceptDraw PRO software with physical security plan, security chart, access chart, security plans, access schemes, access plans , CCTV System Plan samples, templates and libraries of design elements for drawing the Security and Acce
HelpDesk
How to Organize a Social Media Activity
AWS

 Cloud Computing Diagrams
The Cloud Computing Diagrams solution extends the functionality of the ConceptDraw PRO diagramming software with a comprehensive collection of libraries of commonly accepted cloud computing vector stencils to help you to get started designing Cloud Computing Diagrams, Architecture Diagrams and Cloud Computing Architecture Diagrams without effort. This solution lets one professionally depict the way how the cloud computing works, allows giving a powerful introduction to the Cloud computing architecture and Amazon cloud computing architecture, to display the essence of the cloud computing, the main characteristics and classification of the cloud services thanks to the wide variety of predesigned samples and examples.
 Business Process Diagrams
Business Process Diagrams solution extends the ConceptDraw PRO BPM software with RapidDraw interface, templates, samples and numerous libraries based on the BPMN 1.2 and BPMN 2.0 standards, which give you the possibility to visualize equally easy simple and complex processes, to design business models, to quickly develop and document in details any business processes on the stages of project’s planning and implementation.
 Organizational Charts
Organizational Charts solution extends ConceptDraw PRO software with samples, templates and library of vector stencils for drawing the org charts.
 Seven Basic Tools of Quality
Manage quality control in the workplace, using fishbone diagrams, flowcharts, Pareto charts and histograms, provided by the Seven Basic Tools of Quality solution.
- Activity Diagram For Remote Computer Monitoring System
- Remote Computer Monitoring System Activity Diagram
- Remote Monitoring System Activity Diagram
- Remote Computer Monitor System Case Tool Activity Diagram
- Activity Diagram Example Monitoring
- Remote Computer Monitoring Class Diagram
- Remote Monitoring System Uml Diagrams Free Download
- Use Case Diagram For Remote Computer Monitoring
- Remote Computer Monitoring For Uml Diagram
- Class Diagram For Remote Computer Moitering
- Remote Computer Monitoring System For Component Diagram
- Uml Diagrams Remote Computer Monitoring
- Use Case Diagram For Remote Computer Monitoring System
- Uml Use Case Diagram For Remote Computer Network
- Usecase Diagram For Remote Computer Monitoring
- Remote Computer Monitoring Uml Diagram
- Remote Computer Monitoring System Uml Diagrams Free Download
- Remote Computer Monitoring System Class Diagram
- Computer Monitoring Usecase Diagram