KPI Dashboard

Project Dashboard — Radar Chart

 PM Dashboards
The PM Dashboards solution extends the management boundaries of ConceptDraw DIAGRAM and ConceptDraw PROJECT products with an ability to demonstrate changes to the budget status, to show the project progress toward its objectives, to display clearly the identified key performance indicator (KPI) or the set of key performance indicators for any project. This solution provides you with examples and ability to generate three types of visual dashboards reports based on your project data Project Dashboard, Tactical Dashboard, and Radar Chart. By dynamically charting the project’s key performance indicators that are collected on one ConceptDraw DIAGRAM document page, all project participants, project managers, team members, team leaders, stakeholders, and the entire organizations, for which this solution is intended, have access to the daily status of projects they are involved in.
"A performance indicator or key performance indicator (KPI) is a type of performance measurement. An organization may use KPIs to evaluate its success, or to evaluate the success of a particular activity in which it is engaged. Sometimes success is defined in terms of making progress toward strategic goals, but often success is simply the repeated, periodic achievement of some level of operational goal (e.g. zero defects, 10/ 10 customer satisfaction, etc.). Accordingly, choosing the right KPIs relies upon a good understanding of what is important to the organization. 'What is important' often depends on the department measuring the performance - e.g. the KPIs useful to finance will be quite different from the KPIs assigned to sales. Since there is a need to understand well what is important (to an organization), various techniques to assess the present state of the business, and its key activities, are associated with the selection of performance indicators. These assessments often lead to the identification of potential improvements, so performance indicators are routinely associated with 'performance improvement' initiatives." [Performance indicator. Wikipedia]
The example "Website KPIs - Visual dashboard" was created using the ConceptDraw PRO diagramming and vector drawing software extended with the Composition Dashboard solution from the area "What is a Dashboard" of ConceptDraw Solution Park.
The example "Website KPIs - Visual dashboard" was created using the ConceptDraw PRO diagramming and vector drawing software extended with the Composition Dashboard solution from the area "What is a Dashboard" of ConceptDraw Solution Park.
Visual dashboard

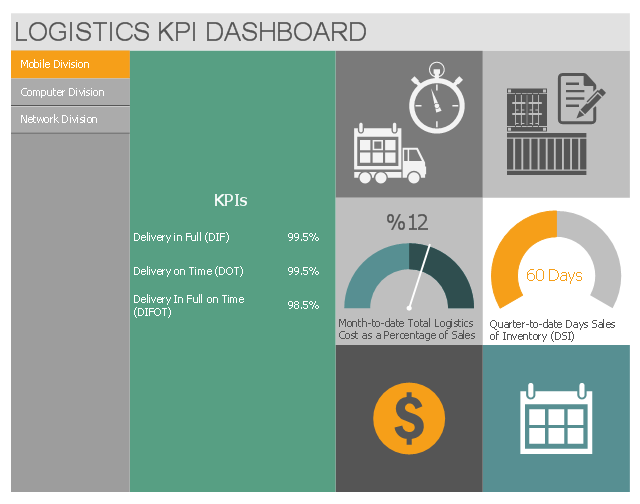
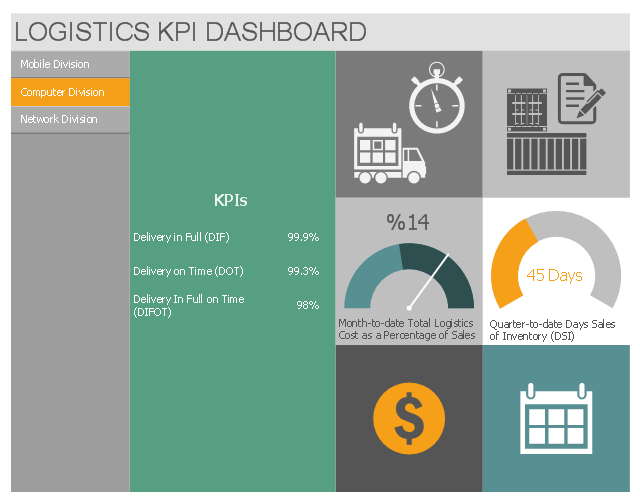
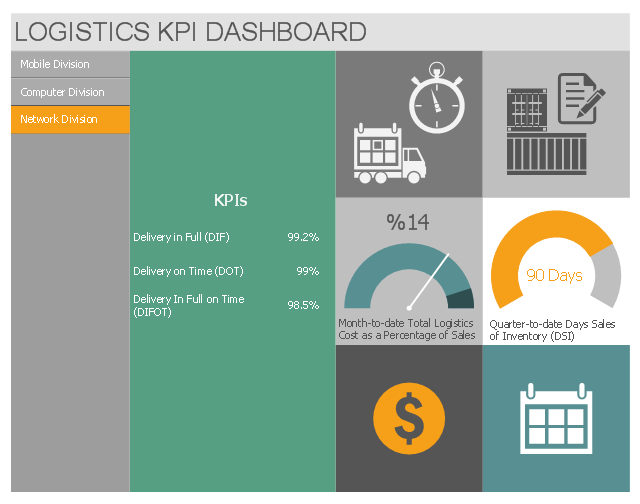
This multipage business dashboard example shows navigation vertical menu and graphic indicators of logistic key performance indicators (KPIs) and business metrics.
"A performance indicator or key performance indicator (KPI) is a type of performance measurement. KPIs evaluate the success of an organization or of a particular activity in which it engages. Often success is simply the repeated, periodic achievement of some levels of operational goal..., and sometimes success is defined in terms of making progress toward strategic goals. Accordingly, choosing the right KPIs relies upon a good understanding of what is important to the organization." [Performance indicator. Wikipedia]
The performance dashboard example "Logistics KPI Dashboard" was designed using ConceptDraw PRO software extended with Logistic Dashboard solution from Business Processes area of ConceptDraw Solution Park.
Mobile Division
Computer Division
Network Division
 Status Dashboard
Status dashboard solution extends ConceptDraw DIAGRAM software with templates, samples and vector stencils libraries with graphic indicators for drawing the visual dashboards showing status data.
Performance Indicators

 HR Dashboard
The HR Dashboard solution extends ConceptDraw DIAGRAM functionality with powerful drawing tools and great collection of comprehensive vector design elements, icons, pictograms and objects, navigation elements, live objects of HR charts, HR indicators, and thematic maps. The range of HR Dashboards applications is extensive, among them the human resource management, recruitment, hiring process, human resource development. ConceptDraw DIAGRAM software is perfect for creation HR Dashboard with any goal you need. It gives you all opportunities for designing not only informative, but also professional looking and attractive HR Dashboards of any style and degree of detalization, that are perfect for using in presentations, reports and other thematic documents.
This sales performance dashboard example includes KPIs indicators and business metrics charts: bullet indicator - "Win Ratio vs. Last Year", gauge (speedometer) indicators - "Open Deals vs. Last Year" and "YTD Sales vs. Last Year", column chart - "Leads created", line chart - "Opportunities Won", alarm indicators - "Sales Ratios", horizontal bar chart - "Top Products in Revenue".
The example "Sales performance dashboard" was created using the ConceptDraw PRO diagramming and vector drawing software extended with the Sales Dashboard solution from the Marketing area of ConceptDraw Solution Park.
www.conceptdraw.com/ solution-park/ marketing-sales-dashboard
The example "Sales performance dashboard" was created using the ConceptDraw PRO diagramming and vector drawing software extended with the Sales Dashboard solution from the Marketing area of ConceptDraw Solution Park.
www.conceptdraw.com/ solution-park/ marketing-sales-dashboard
Sales dashboard

 Education Package
Education Package is a comprehensive set of multifarious graphical solutions from ConceptDraw Solution Park, collected together in help to ConceptDraw DIAGRAM users working in a field of science, education and training, which is aimed at improving the quality of education and helping to design with ease variety of interesting and colorful educational materials, diagrams, charts and maps. Use it to present the information and knowledge in an interesting, clear, structured and simple form to achieve a success in education and pedagogy, to maintain the interest of students and pupils throughout the whole learning process, at the lectures, lessons and even during independent work with additional materials, to contribute to better perception of scientific information by listeners during the conferences and reports.
 Visual Reports
The Visual Reports solution extends abilities of ConceptDraw PROJECT by creating the illustrative, informative, colourful and comprehensible reports on a project in a form of visual graphs and diagrams of common types, such as Bar Charts, Pie Charts, Line Charts, Divided Bar Charts, Timelines, Dial Dashboards. This highly effective project management tool helps project managers and other stakeholders to report about the tasks statuses, the project progress and degree of its completion, to evaluate the project status, to depict the project expenses by days and to define the days that go beyond the budget, to compare visually the actual expenses and expected ones at the project planning stage, to generate the Resource chart depicting the utilization of project resources by days, and to show other useful information. The set of tailor-made examples developed for the Visual Reports solution allows designating advantages of each type of report included to this solution for the further use in your management work.
 Customer Journey Mapping
Customer Journey Mapping Solution for ConceptDraw DIAGRAM opens incredibly broad opportunities for marketing and business specialists, product managers, designers, engineers, and other people interested in business development, increasing the product’s audience, its success and users' demand, providing them with capabilities of customer journey mapping. The included diagramming and customer journey mapping tools, predesigned vector customer journey mapping icons and charts, consumer journey mapping connectors, user journey and customer mapping figures, customer experience map icons and touchpoint icons, quick-start templates and samples provide excellent conditions for the customer journey mapping process, for creating Customer Journey Map and Customer Experience Map.
 PM Presentations
The PM Presentations solution extends the power of ConceptDraw MINDMAP , ConceptDraw DIAGRAM , and ConceptDraw PROJECT, improving their efficiency at many stages of the project management process by using the same source data to construct the targeted presentation for your audience and clearly communicating the appropriate information to different audiences from a single source. It gives an ability to project managers and other team participants to create and to deliver capacious presentations representing the data and knowledge of a specific project with the help of including visual dashboards, Gantt charts, resource views, maps, timelines, calendars, illustrations, project diagrams and reports of varied types. Having the possibility to edit collaboratively in a Full-Screen Mode, the teams can rapidly plan a project as well as execute the tasks of revising and making changes to it.
 Classic Business Process Modeling
The ConceptDraw DIAGRAM software enhanced with Classic Business Process Modeling solution is a powerful flowchart maker and professional business process modeling software with extensive choice of drawing tools, libraries with wide variety of ready-to-use vector objects that are more than sufficient for modeling the business processes and for instant creation variety of diagram types: Control Flow Diagram, Swimlane Diagram, Business Process Modeling Diagram, Functional Flow Block Diagram, Data Flow Diagram. It is ideal for business analysts, developers, as well as for managers and regular users. The samples included to Classic Business Process Modeling solution allow to uncover the solution’s power and to answer qualitatively on how to create a flowchart or to model the business processes with help of diagrams and schemes.
 Seven Management and Planning Tools
Seven Management and Planning Tools solution extends ConceptDraw DIAGRAM and ConceptDraw MINDMAP with features, templates, samples and libraries of vector stencils for drawing management mind maps and diagrams.
 Biomedicine
Biomedicine solution extends ConceptDraw DIAGRAM ector diagramming software with abundance of samples and libraries of vector biomedical icons, pictograms of biomedical sciences and biomedical technologies, the main purpose of which is to help biomedical doctors, biomedical researchers, scientific professionals, professors in biomedical science, technicians, lectors, students to describe visually and to illustrate new achievements and new technologies in biomedical science, results of experiments and tests at this field, to depict the history of biomedicine development, the stages and progress at this field, to plan future biomedicine technologies and to describe those that are now in development or on the stage of testing the biomedical technology by biomedical specialists, to design colorful and professionally looking illustrations, diagrams, presentation slides and infographics in fields of biomedicine, personalized medicine, regenerative medicine, molecular medicine, evidence-based medicine, reconstructive biomedicine, and preventive health care.
 Google Cloud Platform
Google Cloud Platform solution extends the ConceptDraw DIAGRAM functionality with extensive collection of drawing tools, ready-made samples and professionally designed specific Google Cloud Platform icons, allowing effectively design Google Cloud Platform (GCP) architectural diagrams, Google Cloud Platform drawings, GCP schematics of different complexity, and to illustrate on them the work of Google Cloud Platform (GCP), best features of GCP, its services, solutions and products, and the ways of their use.
 Health Informatics
Health Informatics solution supplies the ConceptDraw DIAGRAM with tools and functionalities in a field of healthcare design and healthcare informatics. Including collection of professionally designed samples and a lot of high-quality health informatics vector design objects, it is the best for all medical workers and healthcare-related specialties when designing diagrams, schematics, flow charts, workflow charts, block diagrams, infographics, illustrations, and presentations slides in a field of Health Informatics, representing the newest medical information technologies, architectures of healthcare systems, principles of work of the specialized software, structures of health records systems, medical researches processes.
 Pharmacy Illustrations
Pharmacy Illustrations solution with improbable quantity of predesigned vector objects and icons of pharmacy symbols, medical and health products, pharmacy images of drugstore products, pharmacy clipart of medication tools, pharmacy logo, and other pharmacy pictures is the best for designing the pharmacy illustrations of varied kinds, pharmacy and medical diagrams and schematics, for making the presentation slides and posters on the medical, pharmacy, pharmacology and pharmaceutical thematics, for designing the illustrative materials about ways of prevention diseases and also treatment them, for creation colorful illustrations helpful in newborn and baby care, the infographics and collages to be presented at the premises of medical establishments and during the lectures at the medical education institutions, also on the billboards and in other advertising materials.
 Funnel Diagrams
Funnel Diagrams solution including wide range of funnel diagram samples, sales funnel examples, and vector design elements, makes the ConceptDraw DIAGRAM ideal for funnel management and creation the Funnel Diagrams of different types and designs, AIDA Model, AIDAS, ACCA Dagmar, Rossiter-Percy Model, Sales funnel, Marketing funnel, Search funnel, Brand funnel, Purchase funnel, Lead funnel, Conversion funnel, Business funnel, etc. You are free to choose to place your funnel object horizontally or vertically, you can use the objects with desired quantity of sales funnel stages, as well as to modify their size, color filling, and other parameters to make exceptionally looking Funnel diagrams fully responding to your desires.
- Radar Chart
- KPI Dashboard | A KPI Dashboard | Logistics KPI Dashboard ...
- Performance Indicators | Constant improvement of key performance ...
- KPI Dashboard | A KPI Dashboard | Logistics KPI Dashboard ...
- Website KPIs - Visual dashboard | A KPI Dashboard | Sales KPIs ...
- The Facts and KPIs | A KPI Dashboard | KPIs and Metrics | Kpis
- Logistics Performance Dashboard - Template | Sales KPIs ...
- How to Create a Sales Dashboard Using ConceptDraw PRO | Status ...
- Website traffic dashboard | Website KPIs - Visual dashboard ...
- Sales Analytics | KPI Dashboard | The Facts and KPIs | Key ...
- Sales Dashboard Template | Sales KPI Dashboards | Visualize ...
- Website traffic dashboard | Website metrics - Visual dashboard ...
- Sales metrics and KPIs - Visual dashboard | Website KPIs - Visual ...
- What is a KPI? | Website KPIs - Visual dashboard | ConceptDraw ...
- Cafe performance metrics vs. air temperature - Visual dashboard ...
- KPI Dashboard | What is a KPI? | Performance Indicators | Key ...
- Sales metrics and KPIs - Visual dashboard | Sales KPIs ...
- Composition Dashboard | Pie Chart Software | What is a Dashboard ...
- Enterprise dashboard | Design elements - Status indicators | Design ...
- Design elements - Meter indicators