This site uses cookies. By continuing to browse the ConceptDraw site you are agreeing to our Use of Site Cookies.

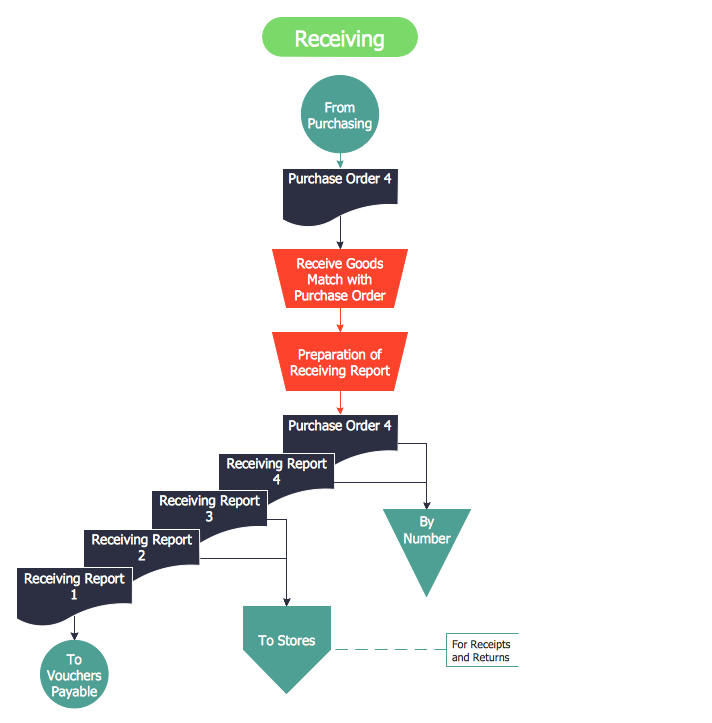
Accounting Flowchart: Purchasing, Receiving, Payable and Payment

Accounting flowchart is a system of processes to represent accounting system of an organization. How to create flowcharts for an accounting information system.

Pyramid Diagram

Pyramid diagram is a chart used to visualize the data in a hierarchical (pyramid-like) structure and depict the foundation-based relationships. Pyramid diagram looks like a triangle divided by lines into several sections (layers) and can be oriented up or down, and represented in 2D or 3D view. 2D Pyramid diagrams are a great way to illustrate the hierarchical structure, 3D Pyramids are equally good to represent the class stratification and hierarchy. ConceptDraw DIAGRAM diagramming and vector drawing software with included Pyramid Diagrams solution from Marketing area of ConceptDraw Solution Park is a powerful application which contains templates and library of vector design elements for instantly drawing three level Pyramid model, four level and five level Triangle charts. All predesigned objects are easy for changing color style and resizing according to your needs, and ConceptDraw documents with Pyramid diagrams can be easy exported in various formats for further using in marketing presentations, for effective analyzing hierarchy levels and illustration your data and ideas.

What process should be essentially adopted. Accounting Flowchart Example

The Accounting flowchart shows how information flows from source documents through the accounting records. The are based on the accounting procedures or processes.

How to Create Flowcharts for an Accounting Information System

Accounting information is a system of interrelated processes which represent financial and accounting data, required for decision making. For representing the accounting processes in a visual and easy for perception form are constructed Accounting Flowcharts. For their creation are used special flowchart symbols, this makes Accounting flowcharts understandable for all users of accounting information system and helps them easy understand the sequence of steps involved to accounting processes. But how to create Flowcharts for an Accounting Information System fast and easy? Use of special design software is useful for this. ConceptDraw DIAGRAM software extended with Accounting Flowcharts solution is the best for creation accurate Accounting Flowcharts, for documentation and visually communication on how accounting processes work, how each operation is done. Accounting Flowcharts solution is supplied with library of predesigned commonly used vector symbols, Accounting Flowchart templates and samples demonstrating receiving, purchasing, payment, and other accounting processes.

Accounting Flowchart

Accounting flowchart is a system of processes to represent accounting system of an organization. If you need to know how accounting processes work and how each operation is done, the Accounting Flowcharts Solution for ConceptDraw DIAGRAM has a predesigned library, tips, methods and symbols for easy drawing an Accounting Flowchart.

Organizational Structure

The organizational structure reflects the composition and hierarchy of company's divisions, determines the distribution of authorities and responsibilities within the organization, and facilitates the understanding by workers their responsibilities. It also defines the group of people making key decisions at the company. Visualization of organizational structure of any company, organization or institution is not an easy task, because sometimes the company may include several departments, each with more than thousand persons. For such large organizations often are created the Organizational charts for every department separately. There are many ways of organization's structuring, which determine its work. Often happens that organizational structure adapts to production process. ConceptDraw DIAGRAM extended with unique Organizational Charts solution from Management area of ConceptDraw Solution Park is a powerful organizational structure software, which ideally suits for developing Organizational Charts of any type and any complexity.

Purchase Process Flow Chart, Receiving Process Flow Chart, Accounting Flowchart Example.

The purchasing process follows very specific guidelines and includes a purchasing cycle flowchart and receiving process flow chart. Common key elements of purchasing process. It is important to know how purchasing processes work and how each operation is done.

organizational chart, org chart Organizational Charts

organizational chart, org chart
Organizational Charts solution extends ConceptDraw DIAGRAM software with samples, templates and library of vector stencils for drawing the org charts.

Basic Flowchart Symbols and Meaning

Flowcharts are the best for visually representation the business processes and the flow of a custom-order process through various departments within an organization. ConceptDraw DIAGRAM diagramming and vector drawing software extended with Flowcharts solution offers the full set of predesigned basic flowchart symbols which are gathered at two libraries: Flowchart and Flowcharts Rapid Draw. Among them are: process, terminator, decision, data, document, display, manual loop, and many other specific symbols. The meaning for each symbol offered by ConceptDraw gives the presentation about their proposed use in professional Flowcharts for business and technical processes, software algorithms, well-developed structures of web sites, Workflow diagrams, Process flow diagram and correlation in developing on-line instructional projects or business process system. Use of ready flow chart symbols in diagrams is incredibly useful - you need simply drag desired from the libraries to your document and arrange them in required order. There are a few serious alternatives to Visio for Mac, one of them is ConceptDraw DIAGRAM. It is one of the main contender with the most similar features and capabilities.
How to Build a Flowchart

Business diagrams & Org Charts with ConceptDraw DIAGRAM

The business diagrams are in great demand, they describe the business processes, business tasks and activities which are executed to achieve specific organizational and business goals, increase productivity, reduce costs and errors. They let research and better understand the business processes. ConceptDraw DIAGRAM is a powerful professional cross-platform business graphics and business flowcharting tool which contains hundreds of built-in collections of task-specific vector stencils and templates. They will help you to visualize and structure information, create various Business flowcharts, maps and diagrams with minimal efforts, and add them to your documents and presentations to make them successful. Among them are Data flow diagrams, Organization charts, Business process workflow diagrams, Audit flowcharts, Cause and Effect diagrams, IDEF business process diagrams, Cross-functional flowcharts, PERT charts, Timeline diagrams, Calendars, Marketing diagrams, Pyramids, Target diagrams, Venn diagrams, Comparison charts, Analysis charts, Dashboards, and many more. Being a cross-platform application, ConceptDraw DIAGRAM is very secure, handy, free of bloatware and one of the best alternatives to Visio for Mac users.
Draw Business Process Diagrams