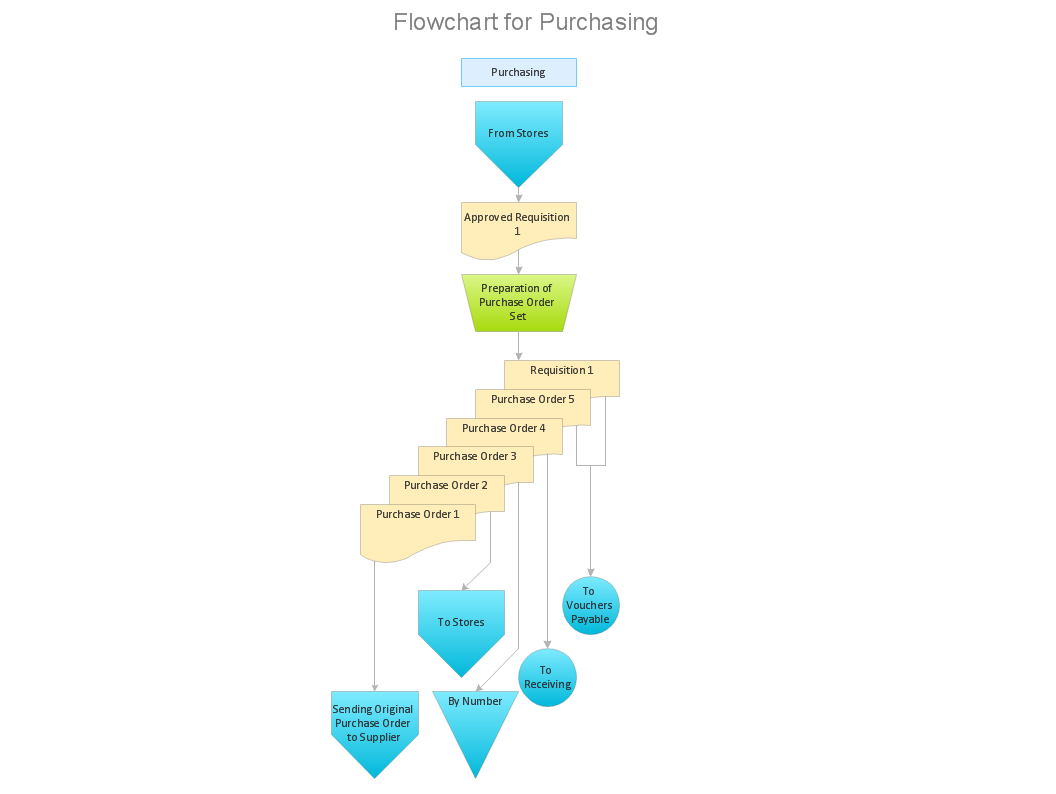
Accounting Data Flow from the Accounting Flowcharts Solution

This exploded pie chart sample shows the economic sector weightings. It was designed on the base of the Wikimedia Commons file: Badpie.png [commons.wikimedia.org/ wiki/ File:Badpie.png].
This image is available under the Creative Commons Attribution-ShareAlike 3.0 Unported License [creativecommons.org/ licenses/ by-sa/ 3.0/ ].
"The classical breakdown of all economic sectors follows:
Primary: Involves the retrieval and production of raw materials, such as corn, coal, wood and iron. (A coal miner and a fisherman would be workers in the primary sector.)
Secondary: Involves the transformation of raw or intermediate materials into goods e.g. manufacturing steel into cars, or textiles into clothing. (A builder and a dressmaker would be workers in the secondary sector.)
Tertiary: Involves the supplying of services to consumers and businesses, such as baby-sitting, cinema and banking. (A shopkeeper and an accountant would be workers in the tertiary sector.)
In the 20th century, it began to be argued that traditional tertiary services could be further distinguished from "quaternary" and quinary service sectors." [Economic sector. Wikipedia]
The exploded pie chart example "Economic sector weightings" was created using the ConceptDraw PRO diagramming and vector drawing software extended with the Pie Charts solution of the Graphs and Charts area in ConceptDraw Solution Park.
Exploded pie chart

Why Flowchart Important to Accounting Information System?

How to Create Flowcharts for an Accounting Information System

Accounting Flowchart: Purchasing, Receiving, Payable and Payment

Accounting Flowchart Purchasing Receiving Payable and Payment

Introduction to bookkeeping: Accounting flowchart process
Flowchart Symbols Accounting. Activity-based costing (ABC) flowchart

 Accounting Flowcharts
Accounting Flowcharts solution extends ConceptDraw DIAGRAM software with templates, samples and library of vector stencils for drawing the accounting flow charts.
Accounting Flowchart Symbols

The vector stencils library "HR professions" contains 81 professions pictograms.
Use this HR icon set to draw your HR flowcharts, workflow diagrams, process charts and infographics with the ConceptDraw PRO diagramming and vector drawing software.
The HR pictograms library "HR professions" is included in the HR Flowcharts solution from the Management area of ConceptDraw Solution Park.
Accountant
Actor

Administrator

Announcer

Archaeologist

Architect

Artist

Baker

Banker

Bellboy

Biologist

Bookkeeper

Builder

Businessman

Businesswoman

Call center operator

Cameraman

Carpenter

Cashier

Chef

Chemist

Cleaner

Clerk

Consultant

Cook

Dentist

Director

Dispatcher

Diver

Doctor

Driver

Electrical engineer

Engineer

Environmental engineer

Farmer

Firefighter

Fisherman

Florist

Gardener

Graphic designer

Guide

Hairdresser

Lawyer

Librarian

Machine operator

Manager

Miner

Movie director
Musician

Nuclear engineer

Nurse

Pharmacist

Photographer

Pilot

Pizza delivery man

Policeman

Postman

Presenter

Programmer

Psychologist

Reporter

Sailor

Scientist

Secretary

Security guard

Security officer

Seller

Shop assistant

Soldier

Stewardess

Surgeon

System administrator

Systems engineer

Tailor

Teacher
Technical support representative

Waiter

Waitress

Watchman

Worker

Writer

The vector stencils library "Professions" contains 58 people clipart images of different professions you can use in your presentations, illustrations and infographics.
"Electronic clip art is available in several different file formats. It is important for clip art users to understand the differences between file formats so that they can use an appropriate image file and get the resolution and detail results they need.
Clip art file formats are divided into 2 different types: bitmap or vector graphics. ...
In contrast to the grid format of bitmap images, Vector graphics file formats use geometric modeling to describe an image as a series of points, lines, curves, and polygons. Because the image is described using geometric data instead of fixed pixels, the image can be scaled to any size while retaining "resolution independence", meaning that the image can be printed at the highest resolution a printer supports, resulting in a clear, crisp image. Vector file formats are usually superior in resolution and ease of editing as compared to bitmap file formats, but are not as widely supported by software and are not well-suited for storing pixel-specific data such as scanned photographs. In the early years of electronic clip art, vector illustrations were limited to simple line art representations." [Clip art. Wikipedia]
The clip art example "Professions - Vector stencils library" was created using the ConceptDraw PRO diagramming and vector drawing software extended with the People solution from the Illustration area of ConceptDraw Solution Park.
www.conceptdraw.com/ solution-park/ illustrations-people
Builder 1

System administrator

Worker of conveyor

Clerk 1

Clerk 2

Student 2

Student 3

Student 1

Dispatcher 1

Accountant

Gardener

Lawyer

Jurist

Judge

Consultant

Manager

Director

Programmer

Architect

Pilot

Policeman

Secretary

Security officer

Clerk 3

Musician

Presenter

Athlete

Artist

Announcer

Photographer

Hairdresser

Florist

Spaceman

Engineer

Reporter

Tailor

Dispatcher 2

Biologist

Chemist

Dentist

Priest

Soldier

Doctor

Driver

Carpenter

Fireman

Seaman

Builder 2

Postman

Miner

Waiter

Cleaner

Cashier

Shop assistant

Cook

Flight attendant

Teacher

Hall porter

 Office Layout Plans
Office layouts and office plans are a special category of building plans and are often an obligatory requirement for precise and correct construction, design and exploitation office premises and business buildings. Designers and architects strive to make office plans and office floor plans simple and accurate, but at the same time unique, elegant, creative, and even extraordinary to easily increase the effectiveness of the work while attracting a large number of clients.
SWOT Sample in Computers

SWOT Matrix Template

- Process Flowchart | Accountant Png Cartoon Graphic Pics
- Financial Accounting Clipart Png
- Accountant Icon Png
- Carpenter Icon Png
- Introduction to bookkeeping: Accounting flowchart process | HR ...
- Cook Vector Png
- Fisher Man Png
- HR professions - Vector stencils library | Secretary Icon Pictogram Png
- HR professions - Vector stencils library | Tour Operator Icon Png
- Executive Driver Vector Png
- Speak Mic Vector Png
- HR professions - Vector stencils library | Delivery Boy Clipart Png
- Producer Icon Png
- 4 Level pyramid model diagram - Information systems types ...
- Png Vector Graphics People
- Post Man Png
- Worker Clipart Png
- Vector Png Images
- Vector Characters Png
- Electric Worker Png Image