 Cross-Functional Flowcharts
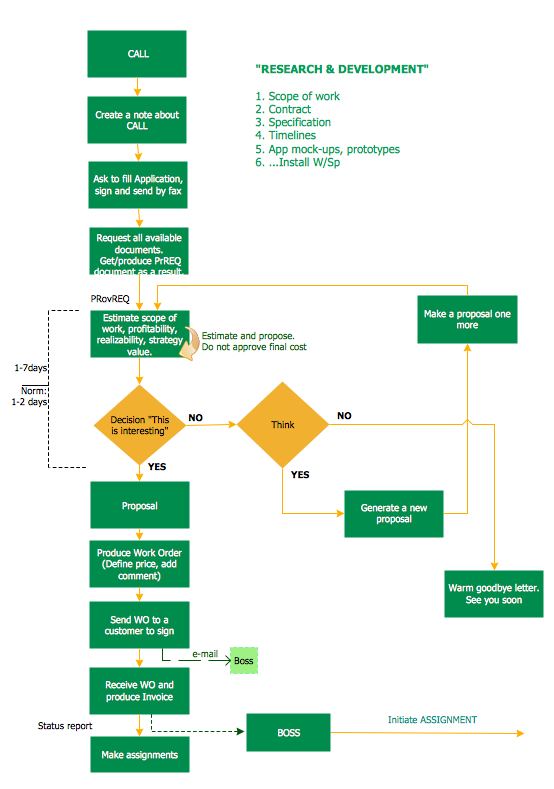
Cross-functional flowcharts are powerful and useful tool for visualizing and analyzing complex business processes which requires involvement of multiple people, teams or even departments. They let clearly represent a sequence of the process steps, the order of operations, relationships between processes and responsible functional units (such as departments or positions).
Electrical Symbols, Electrical Diagram Symbols

Best Program to Make Workflow Diagrams
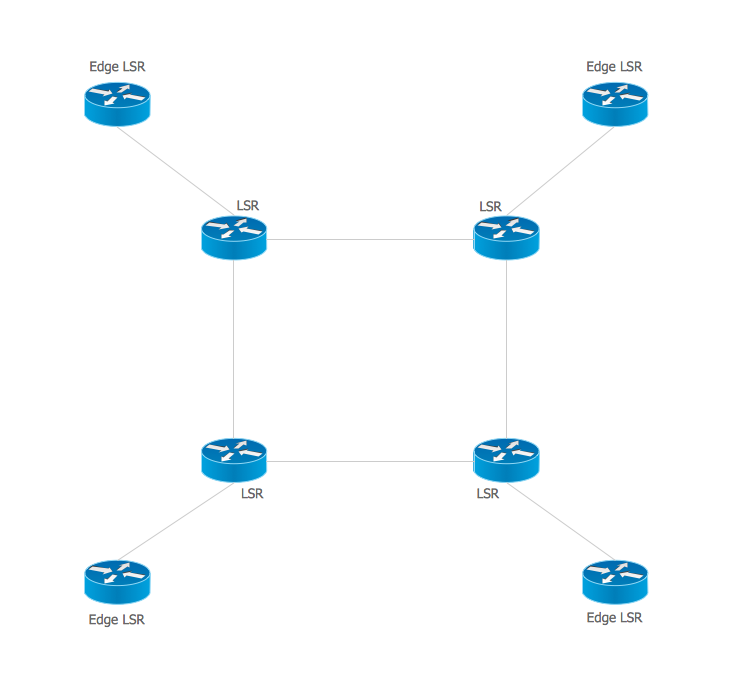
Multiprotocol Label Switching (MPLS). Computer and Network Examples

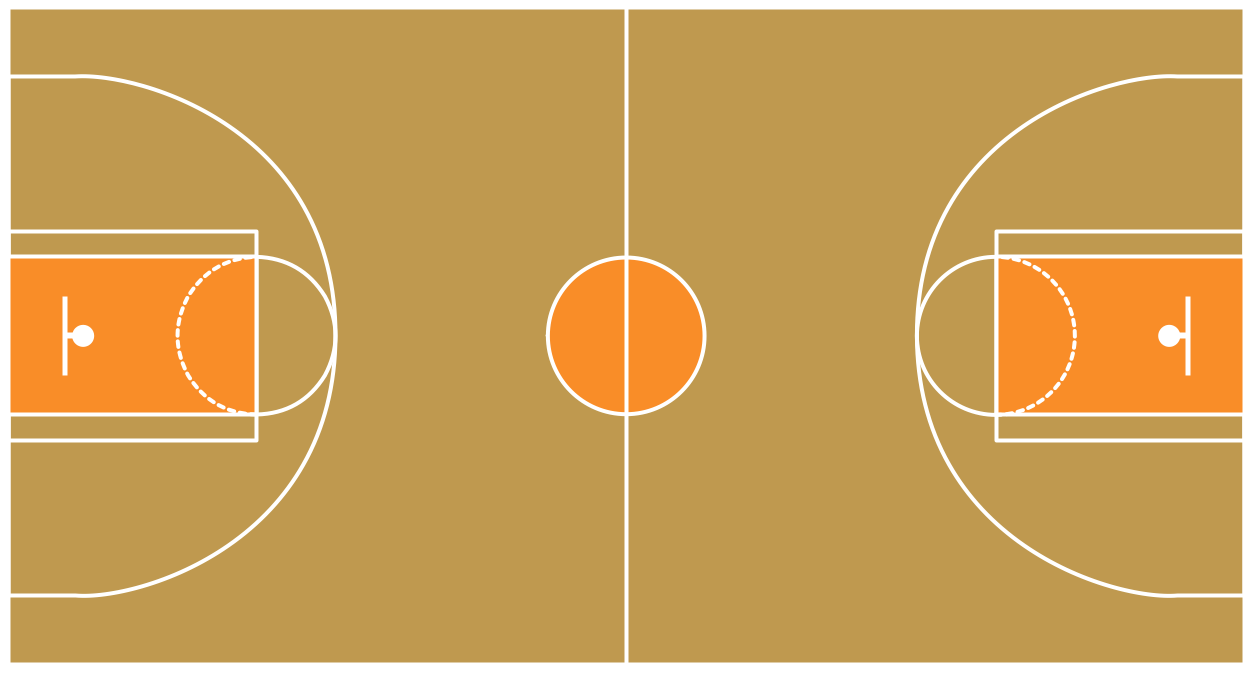
Basketball Field in the Vector
ERD Symbols and Meanings


 Soccer
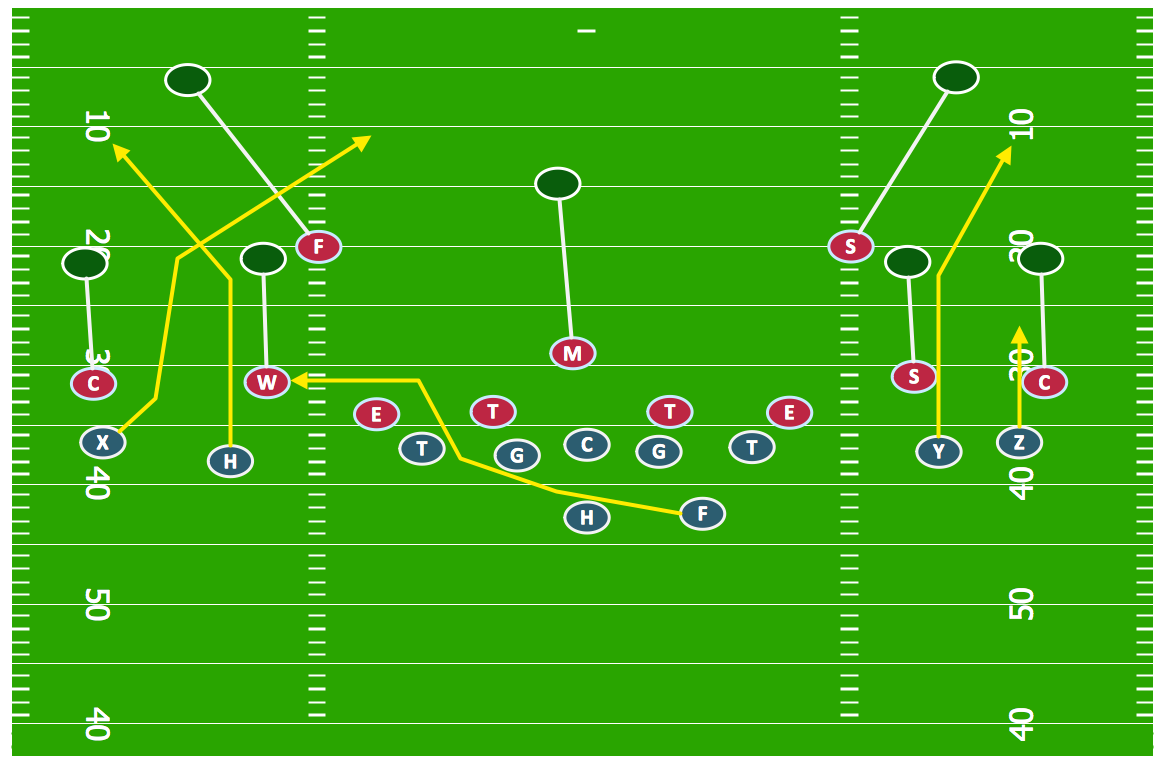
The Soccer (Football) Solution extends ConceptDraw DIAGRAM.5 (or later) software with samples, templates, and libraries of vector objects for drawing soccer (football) diagrams, plays schemas, and illustrations. It can be used to make professional looking
 Office Layout Plans
Office layouts and office plans are a special category of building plans and are often an obligatory requirement for precise and correct construction, design and exploitation office premises and business buildings. Designers and architects strive to make office plans and office floor plans simple and accurate, but at the same time unique, elegant, creative, and even extraordinary to easily increase the effectiveness of the work while attracting a large number of clients.
Sales Process Steps

 SYSML
SYSML
The SysML solution helps to present diagrams using Systems Modeling Language; a perfect tool for system engineering.
 Website Wireframe
The innovative Website Wireframe solution enhances the ConceptDraw DIAGRAM functionality with newest wireframe tools, libraries with variety of predesigned icons, symbols, buttons, graphics, forms, boxes, and many other vector elements, templates and professionally designed samples, which make it the best wireframing software. Website Wireframe solution gives you significant advantages when designing and maintaining websites, creating skeletal and content-free depictions of website structure, making website prototypes and planning the content arrangement before committing to design, also speeds up the processes of sketching, producing and sharing wireframe examples of website style and interface design.
Offensive Strategy — Spread Offense Diagram
Example Process Flow Chart

 Flowcharts
The Flowcharts solution for ConceptDraw DIAGRAM is a comprehensive set of examples and samples in several varied color themes for professionals that need to represent graphically a process. Solution value is added by the basic flow chart template and shapes' libraries of flowchart notation. ConceptDraw DIAGRAM flow chart creator lets one depict the processes of any complexity and length, as well as design the Flowchart either vertically or horizontally.
 Computer Network Diagrams
Computer Network Diagrams solution extends ConceptDraw DIAGRAM software with samples, templates and libraries of vector icons and objects of computer network devices and network components to help you create professional-looking Computer Network Diagrams, to plan simple home networks and complex computer network configurations for large buildings, to represent their schemes in a comprehensible graphical view, to document computer networks configurations, to depict the interactions between network's components, the used protocols and topologies, to represent physical and logical network structures, to compare visually different topologies and to depict their combinations, to represent in details the network structure with help of schemes, to study and analyze the network configurations, to communicate effectively to engineers, stakeholders and end-users, to track network working and troubleshoot, if necessary.
- Soccer | Vertical Arrangement In Pictograms
- Management pictograms - Vector stencils library | How to Create a ...
- Swimming pool | Recreation signs - Vector stencils library | Swim ...
- Basic Line Graphs | GHS Hazard Pictograms | Arrows - Vector clipart ...
- Economic sector weightings | Seating Plans | People pictograms ...
- Process Flowchart | How to Draw Pictorial Chart. How to Use ...
- Value added contributed by foreign-owned | Marketing infogram 3 ...
- Design elements - UML timing diagrams
- Design elements - Comparison charts and indicators | Basic ...
- GHS Label Pictograms | Multiprotocol Label Switching (MPLS ...
- Bar Graphs | Basic Bar Graphs | Marketing infogram 3 - Template ...
- Business Process Elements: Swimlanes | Design elements ...
- Soccer (Football) Field Templates | Vertical association football pitch ...
- Bar Chart Template for Word | Double bar graph - Template | Bar ...
- Sample Pictorial Chart. Sample Infographics | Business Report Pie ...
- Network Icon | Cisco WAN. Cisco icons, shapes, stencils and ...
- Building Drawing Design Element: Plumbing | Ecology pictograms ...
- Ecology pictograms - Vector stencils library | Types of Flowcharts ...
- Soccer | GHS Hazard Pictograms | Cross-Functional Flowcharts ...
- Winter Sports. Using Winter Sports Design Elements Producing ...