SWOT Analysis

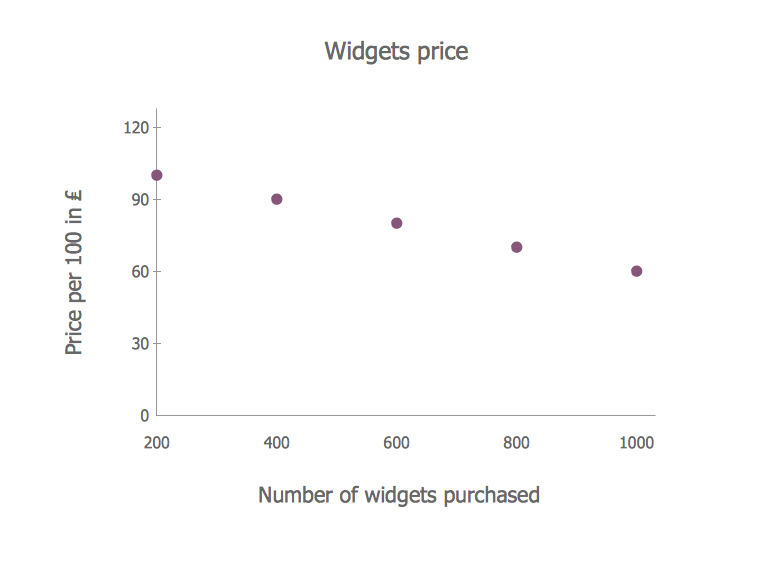
Scatter Diagram
Competitor Analysis

 Bubble Diagrams
Bubble diagrams have enjoyed great success in software engineering, architecture, economics, medicine, landscape design, scientific and educational process, for ideas organization during brainstorming, for making business illustrations, presentations, planning, design, and strategy development. They are popular because of their simplicity and their powerful visual communication attributes.
Marketing Charts
 Mechanical Engineering
This solution extends ConceptDraw DIAGRAM.9 mechanical drawing software (or later) with samples of mechanical drawing symbols, templates and libraries of design elements, for help when drafting mechanical engineering drawings, or parts, assembly, pneumatic,
 Diagrams Area
Solutions of the area Diagrams from ConceptDraw Solution Park collect templates, samples and vector stencils libraries for drawing diagrams visualizing qualitative information and knowledge.
 Education Package
Education Package is a comprehensive set of multifarious graphical solutions from ConceptDraw Solution Park, collected together in help to ConceptDraw DIAGRAM users working in a field of science, education and training, which is aimed at improving the quality of education and helping to design with ease variety of interesting and colorful educational materials, diagrams, charts and maps. Use it to present the information and knowledge in an interesting, clear, structured and simple form to achieve a success in education and pedagogy, to maintain the interest of students and pupils throughout the whole learning process, at the lectures, lessons and even during independent work with additional materials, to contribute to better perception of scientific information by listeners during the conferences and reports.
 Marketing Diagrams
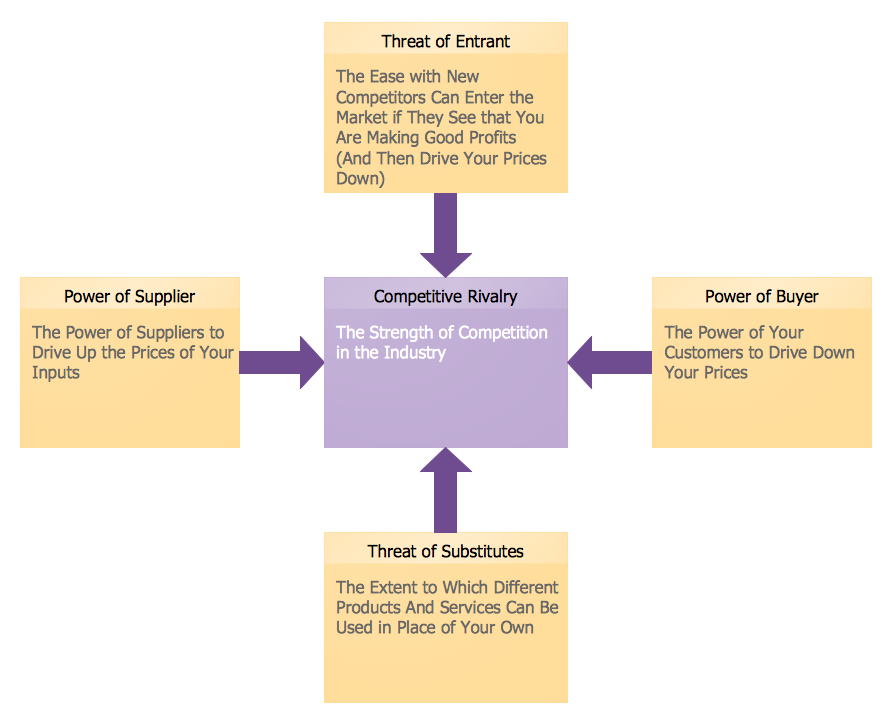
Marketing Diagrams solution extends ConceptDraw DIAGRAM diagramming software with abundance of samples, templates and vector design elements intended for easy graphical visualization and drawing different types of Marketing diagrams and graphs, including Branding Strategies Diagram, Five Forces Model Diagram, Decision Tree Diagram, Puzzle Diagram, Step Diagram, Process Chart, Strategy Map, Funnel Diagram, Value Chain Diagram, Ladder of Customer Loyalty Diagram, Leaky Bucket Diagram, Promotional Mix Diagram, Service-Goods Continuum Diagram, Six Markets Model Diagram, Sources of Customer Satisfaction Diagram, etc. Analyze effectively the marketing activity of your company and apply the optimal marketing methods with ConceptDraw DIAGRAM software.
Business Package for Management
Package intended for professional who designing and documenting business processes, preparing business reports, plan projects and manage projects, manage organizational changes, prepare operational instructions, supervising specific department of an organization, workout customer service processes and prepare trainings for customer service personal, carry out a variety of duties to organize business workflow.
Structured Systems Analysis and Design Method (SSADM) with ConceptDraw DIAGRAM

How To Do A Mind Map In PowerPoint

This SWOT matrix diagram example was created on the base of article "An Easy Way To Jumpstart Your Strategic Plan: SWOT" by Leslie Wolf from the website of the California Digital Library, the University of California. "Strategic planning doesn’t have to be a daunting and lengthy process. The goal is really a simple one: to help you understand your world and build a road map to guide your efforts. ...
This analysis tool can help you focus your attention on the specific success factors that are right for your team.
The tool is called a SWOT analysis. SWOT stands for Strengths and Weaknesses, Opportunities and Threats. Here’s what it means:
(1) Strengths are those positive internal attributes that strengthen your business or team. You can develop plans to capitalize on those strengths.
(2) Weaknesses are those negative internal attributes that are working against your success. You can shore up those weaknesses so they don’t stop your success.
(3) Opportunities are those external conditions that can have a positive effect on your goals. These opportunities can point you in the right direction.
(4) Threats are those external conditions that can have a negative effect on your goals. These threats will affect you less if you can identify and minimize them. ...
We thought it would be helpful to show you a sample SWOT analysis for a business you can easily visualize: a small independent bookstore in a university town. The store owner brought the team together to think about how the bookstore could survive during the continuing financial downturn. After an hour of brainstorming, this is the SWOT analysis they developed." [cdlib.org/ cdlinfo/ 2010/ 09/ 29/ an-easy-way-to-jumpstart-your-strategic-plan-swot/ ]
The matrix diagram example "SWOT analysis for a small independent bookstore" was created using the ConceptDraw PRO diagramming and vector drawing software extended with the SWOT Analysis solution from the Management area of ConceptDraw Solution Park.
SWOT matrix

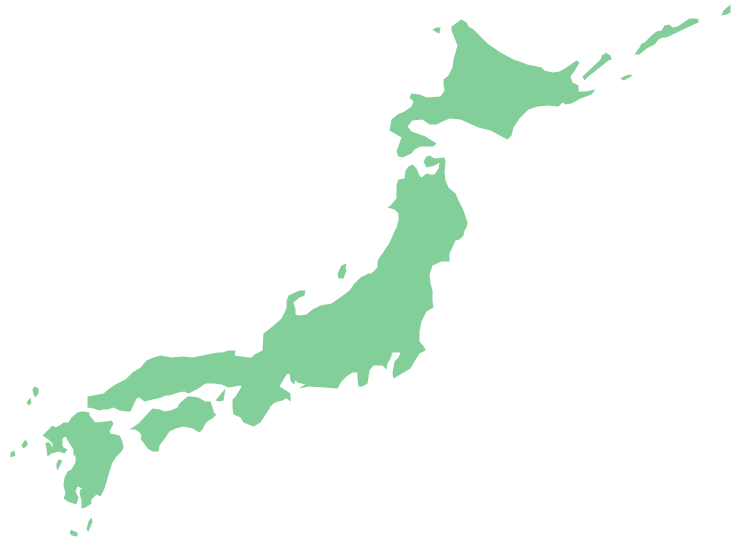
Geo Map - Asia - Japan
- Chart For Strength Of Solution
- Draw A Chart Strength Of Solution
- Draw A Chart For Strength Solution
- Chart For The Strength Of Solution
- A Chart For Strength Of Solution
- Chart Of Strength Of Solution
- Strength Of Solution Chart
- Chart Strength Of Solution
- Draw A Chart For Strength Of Solution
- SWOT Template | Simple Business Goal Strenght
- Design elements - Hydraulic pumps and motors | Apparatus for ...
- SWOT Template | SWOT Analysis | Gant Chart in Project ...
- Give Me An Example Of Strength In Park
- The Strength Of Shoe Making
- Apparatus for testing the strength of a hydraulic hose splice ...
- SWOT Template | Gant Chart in Project Management | SWOT ...
- Business Goal Strength
- Scatter Diagrams | Scatter Chart Examples | Scatter Diagram ...
- Example Of Strength In Ad Campaign