Cross-Functional Flowchart


SWOT Analysis

Competitor Analysis

Line Chart Examples

Scatter Chart Examples

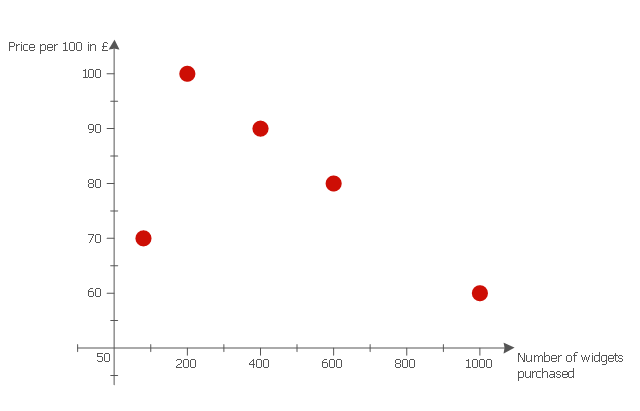
This scatter graph sample illustrates correlation between price per 100 widgets in pound sterling and number of widgets purchased.
"Correlation.
Correlation measures the strength of association between two variables. We will first consider the relationship between two scalar variables and then between ranked variables.
Pearson correlation coefficient.
Pearson's R indicates the strength and direction of association between two scalar variables, ranging from -1 which indicates a strong inverse relationship and 1 indicating a strong direct relationship. At 0 we say there is no correlation; it measures the linear dependence of one variable on another. Linear dependence means that one variable can be computed from the other by a linear equation ...
An inverse correlation.
In the following data we see that as the number of widgets rises, the price per 100 widgets falls. This is an inverse correlation and has a negative value for Pearson's R. ...
For this data the correlation coefficient has a value of -1." [en.wikibooks.org/ wiki/ Statistics_ Ground_ Zero/ Association]
The scatter chart example "Widgets price" was created using the ConceptDraw PRO diagramming and vector drawing software extended with the Scatter Diagrams solution from the Graphs and Charts area of ConceptDraw Solution Park.
Scattergraph
This work flow chart sample was redesigned from the picture "Simulation for earthquake disaster assessment" from the article "Simulation Workflows".
[iaas.uni-stuttgart.de/ forschung/ projects/ simtech/ sim-workflows.php]
" This simulation was developed to have an in depth understanding of the destructions and the decisions to be made in various phases of crisis management (Source: Mahdi Hashemi and Ali A. Alesheikh (2010). "Developing an agent based simulation model for earthquakes in the context of SDI." GSDI 12 World Conference. 19 – 22 October 2010. Singapour). The simulation process contains following major steps:
(1) All spatial information including satellite images (before and after the earthquake) and topographic/ cadastral maps of the area are mosaicked and georeferenced. The parts of the city that contain various levels of destructions are selected. Three types of features namely buildings, roads and recreational areas are classified and extracted from the satellite images.
(2) The governing factors of destructions are identified; a mathematical model that integrates the factors is constructed.
(3) The simulation is constructed for various parameter values (different earthquake strength, time elapses, etc.)" [iaas.uni-stuttgart.de/ forschung/ projects/ simtech/ sim-workflows.php]
The example "Workflow diagram - Earthquake disaster assessment" was drawn using the ConceptDraw PRO diagramming and vector drawing software extended with the Workflow Diagrams solution from the Business Processes area of ConceptDraw Solution Park.
Work flow chart

 Mechanical Engineering
This solution extends ConceptDraw PRO v.9 mechanical drawing software (or later) with samples of mechanical drawing symbols, templates and libraries of design elements, for help when drafting mechanical engineering drawings, or parts, assembly, pneumatic,
Diagrams Mean Nothing

- Draw A Chart For Strength Solution
- Draw A Chart For Strength Of Solution
- Draw A Chart Strength Of Solution
- Feature Comparison Chart Software | SWOT Sample in Computers ...
- Competitive strategy matrix - Template | SWOT Analysis Solution ...
- Porter's generic strategies matrix diagram | Pyramid Chart Examples ...
- Marketing and Sales Organization chart . Organization chart Example
- Production Swot Analysis Strength Examples
- Scatter Chart
- Porter's generic strategies matrix diagram | Competitor Analysis ...
- SWOT Analysis Solution - Strategy Tools | How to Make SWOT ...
- Competitive feature comparison matrix chart - Digital scouting cameras
- Hydraulic circuits | Apparatus for testing the strength of a hydraulic ...
- SWOT Matrix Template | How To Create an Involvement Matrix ...
- Positioning map | Business Tools Perceptual Mapping | Mind Maps ...
- Process Flowchart | How to Create a TQM Diagram Using Total ...
- Scatter Diagrams | How to Draw a Scatter Diagram | Scatter Chart ...
- Porter's generic strategies matrix diagram | Porter's value chain ...
- Marketing | How to Make Soccer Position Diagram Using ...
- Matrices | Ansoff's product / market matrix | SWOT matrix template ...