Fishbone Diagrams
The Fishbone Diagrams solution extends ConceptDraw DIAGRAM software with the ability to easily draw the Fishbone Diagrams (Ishikawa Diagrams) to clearly see the cause and effect analysis and also problem solving. The vector graphic diagrams produced using this solution can be used in whitepapers, presentations, datasheets, posters, and published technical material.
Pyramid Diagrams
Pyramid Diagrams solution extends ConceptDraw DIAGRAM software with templates, samples and library of vector stencils for drawing the marketing pyramid diagrams.
Fishbone Diagram Problem Solving
The Ishikawa diagram, Cause and Effect diagram, Fishbone diagram — all they are the names of one and the same visual method for working with causal connections. Originally invented by Kaoru Ishikawa to control the process quality, the Ishikawa diagram is well proven in other fields of management and personal scheduling, events planning, time management. It is a chart in the form of a fish, whose head is a problem, the fins are variants for its causes.To design easily the Fishbone diagram, you can use a special ConceptDraw DIAGRAM vector graphic and diagramming software which contains the powerful tools for Fishbone diagram problem solving offered by Fishbone Diagrams solution for the Management area of ConceptDraw Solution Park.
ERD Symbols and Meanings
Crow's foot notation is used in Barker's Notation, Structured Systems Analysis and Design Method (SSADM) and information engineering. Crow's foot diagrams represent entities as boxes, and relationships as lines between the boxes. Different shapes at the ends of these lines represent the cardinality of the relationship.The Chen's ERD notation is still used and is considered to present a more detailed way of representing entities and relationships.
To create an ERD, software engineers mainly turn to dedicated drawing software, which contain the full notation resources for their specific database design - ERD symbols and meanings. CS Odessa has released an all-inclusive Entity-Relationship Diagram (ERD) solution for their powerful drawing program, ConceptDraw DIAGRAM.
"Causes in the diagram are often categorized, such as to ...
The 7 Ps (used in marketing industry):
(1) Product/ Service;
(2) Price;
(3) Place;
(4) Promotion;
(5) People/ personnel;
(6) Positioning;
(7) Packaging. " [Ishikawa diagram. Wikipedia]
This 8 Ps Ishikawa diagram (service cause and effect diagram) template is included in the Fishbone Diagram solution from the Management area of ConceptDraw Solution Park.
Venn Diagram Examples for Problem Solving
In the Venn Diagrams solution, there are the pre-made examples that can be always used for making the unique, great looking diagrams, such as the 2-set Venn ones of any needed colour, the 3-set one, the 4-set ones and the 5-set ones. Having the already previously created samples of the Venn diagrams can help any ConceptDraw DIAGRAM user make it possible to make the needed drawing within only a few minutes by editing the existing ones.Fishbone Diagram Procedure
ConceptDraw DIAGRAM diagramming and vector drawing software enhanced with Fishbone Diagrams solution from the Management area of ConceptDraw Solution Park gives the ability to draw Fishbone diagram, which identifies many possible causes for an effect for problem solving. Fishbone Diagram procedure of creation includes the set of steps easy for execution in ConceptDraw DIAGRAM.
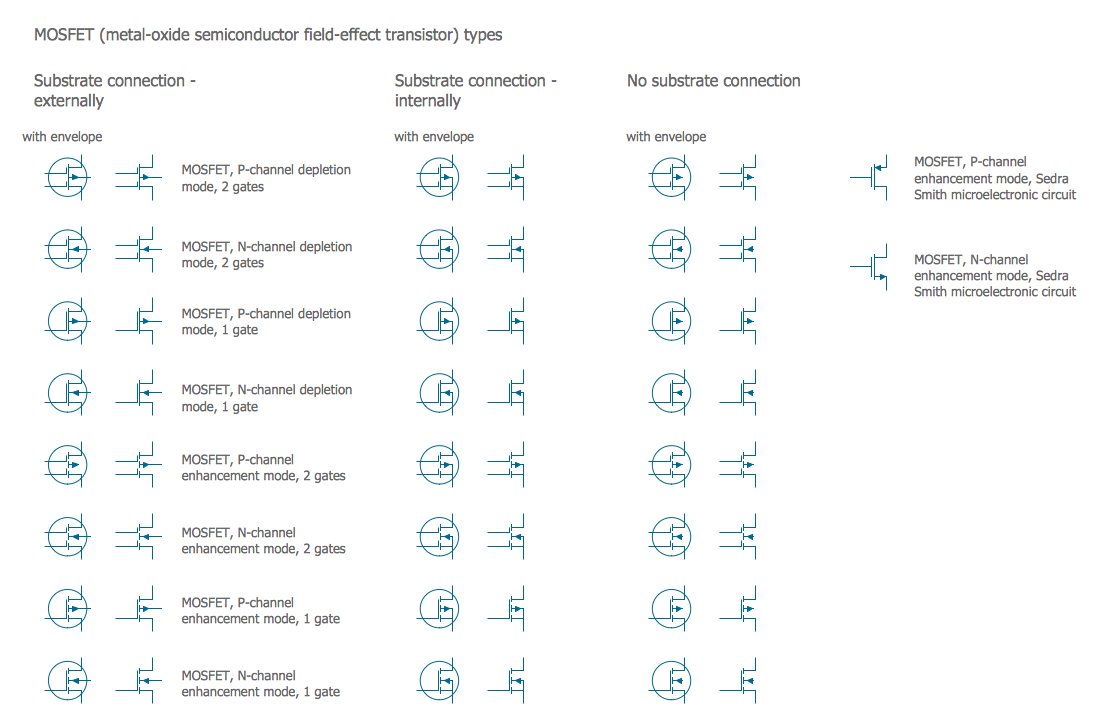
Electrical Symbols — MOSFET
The metal–oxide–semiconductor field-effect transistor (MOSFET, MOS-FET, or MOS FET) is a type of transistor used for amplifying or switching electronic signals.Although the MOSFET is a four-terminal device with source (S), gate (G), drain (D), and body (B) terminals, the body (or substrate) of the MOSFET is often connected to the source terminal, making it a three-terminal device like other field-effect transistors. Because these two terminals are normally connected to each other (short-circuited) internally, only three terminals appear in electrical diagrams. The MOSFET is by far the most common transistor in both digital and analog circuits, though the bipolar junction transistor was at one time much more common.
26 libraries of the Electrical Engineering Solution of ConceptDraw DIAGRAM make your electrical diagramming simple, efficient, and effective. You can simply and quickly drop the ready-to-use objects from libraries into your document to create the electrical diagram.
Piping and Instrumentation Diagram Software
ConceptDraw DIAGRAM is professional Piping and Instrumentation Diagram (P&ID) Software.Plumbing and Piping Plans solution helps you create quick and easy: key piping and instrument details ,piping diagrams, instrumentation diagrams, schemes of hot and cold water supply systems, control and shutdown schemes, diagrams of plumbing systems, heating schemes, schematics of waste water disposal systems, safety and regulatory requirements, diagrams of ventilation systems, mechanical diagrams, industrial diagrams, basic start up and operational information.
Flowchart Marketing Process. Flowchart Examples
This sample shows the Flowchart that displays the layout and work flow of the cloud marketing platform. This diagram has a style of the marketing brochure. This style displays the central product that is related to the other issues.Using the ready-to-use predesigned objects, samples and templates from the Flowcharts Solution for ConceptDraw DIAGRAM you can create your own professional looking Flowchart Diagrams quick and easy.
- 4 P Diagram
- Fishbone Diagram 4 P
- 4 PS Fishbone Diagram
- Fishbone Diagram 4 Ps
- Marketing 4 Ps Template
- Marketing Mix 4 Ps Example
- Service 8 Ps fishbone diagram - Template | SWOT analysis for a ...
- Service 8 Ps fishbone diagram - Template | Fishbone Diagram ...
- Service 8 Ps fishbone diagram - Template | Fishbone Diagrams ...
- Service 4 Ss fishbone diagram - Template | Fishbone Diagram ...
- ERD | Entity Relationship Diagrams, ERD Software for Mac and Win
- Flowchart | Basic Flowchart Symbols and Meaning
- Flowchart | Flowchart Design - Symbols, Shapes, Stencils and Icons
- Flowchart | Flow Chart Symbols
- Electrical | Electrical Drawing - Wiring and Circuits Schematics
- Flowchart | Common Flowchart Symbols