Political Polls
Polls of the population including polls on political topics have become an ordinary phenomenon today. They are the method of getting the opinions of a population by taking answers to a series of questions. Political polls help to find out the opinion of the population on political issues, allow identifying public attitudes in a certain territory. The trends and moods of society under certain circumstances are also predicted with the help of political polls. Surveys allow identifying the most pressing problems, building a political program, and making campaign materials based on them. The popular pre-election political polls allow finding out whether residents are planning to take part in the polls, for whom they are going to vote. Surveys regarding satisfaction with the current work of the authorities, rating polls regarding the level of confidence in exit polls, tactical polls, forming or informing polls are also conducted.
Each person has his own opinion about the political life of his country, this is used in political polls. A set of opinions of all citizens of a certain country forms public opinion. Therefore, the analysis of the responses of a large number of people during a survey allows receiving quantitative characteristics for various opinions in society and making conclusions about the opinion of the majority of citizens of a given country. The opinions received the most responses are accepted dominant. Surveys of the population allow finding out the answers to any questions and can affect the strategy, the basic concept, and other important aspects. They help to predict the trends and moods of society in certain circumstances. The results of polls are also used to identify and sway undecided voters, to motivate candidates, etc.
There are individual, group, and mass surveys. Group surveys involve a conversation of several respondents, while mass surveys are a combination of a large number of individual surveys. For the most part, political polls are mass polls. Surveys are taken in different ways, by telephone, on the street, at a retail outlet, by post, by email, online, etc. Telephone surveys became quite widespread due to their lower cost compared to face-to-face interviews. However online surveys occupy a leading position today.
Political polls are conducted in the form of questionnaires or interviews. The questionnaires are clearly structured lists of questions and are easily technically processed. The interview is a more flexible research tool providing an opportunity to clarify some aspects in the respondent's answers and consider individual topics more deeply. At the same time, the interview requires time-consuming and long-lasting decoding of the answers. Sometimes a standardized interview is used instead of a free-form interview and is a combination of these two types of surveys. A standardized interview is taken according to clearly defined questionnaire questions and they cannot be changed.
Monitoring or trend surveys are one more type of surveys. These are surveys aimed at fixing changes over time in the opinion of respondents in relation to the same political problem or issue. Monitoring surveys are often conducted at monthly intervals. Panel surveys are the kind of trend surveys but are conducted among the same people. They allow fixing the reasons and motives for changes in the opinions of these people, in addition, to recording.
Expert surveys form a separate group, they are conducted among experts in a certain field and allow an objective assessment of certain processes and phenomena. This is one of the most common methods of research in the field of politics. At the same time, an expert survey is typically a one-time or has a trend character.
Example 1. Political Polls
Qualitative and quantitative research methods are used in political polls. Quantitative methods show the general mood of the residents of the region as a percentage. The results of qualitative surveys demonstrate the view of each individual voter on a specific situation and give a more complete assessment of the situation, but they are difficult to express in numbers.
In addition, political polls can be classified as rating and tactical researches. The first ones are held regularly in terms of 3-4 months before political elections and show the recognition of candidates, their ratings and anti-ratings. The second ones provide information about the votes of voters, the effectiveness of agitation activities, expected number of voters. Plus, they help to adjust the strategy and tactics of the party's behavior during the election and make appropriate changes to the election campaign.
However polls are not predictions, they reflect the people's feelings at the moment and do not display exactly what will happen in the future. Public opinion can change during the election or directly before it. The opinion of voters can change from week to week, even from day to day, depending on the events taking place and the behavior of candidates during the election campaign. Therefore, the combination of the results of several surveys conducted at different times and by different methods is the most informative for getting a view of national opinion. Some polls target specific groups of people. Others may include random answers, but even these answers must be processed to reveal the trends in the opinion of voters. The information collected as a result of surveys is easily processed by quantitative and statistical analysis methods. Today, leading political electoral organizations use mathematical methods and computer analysis to collect and process answers.

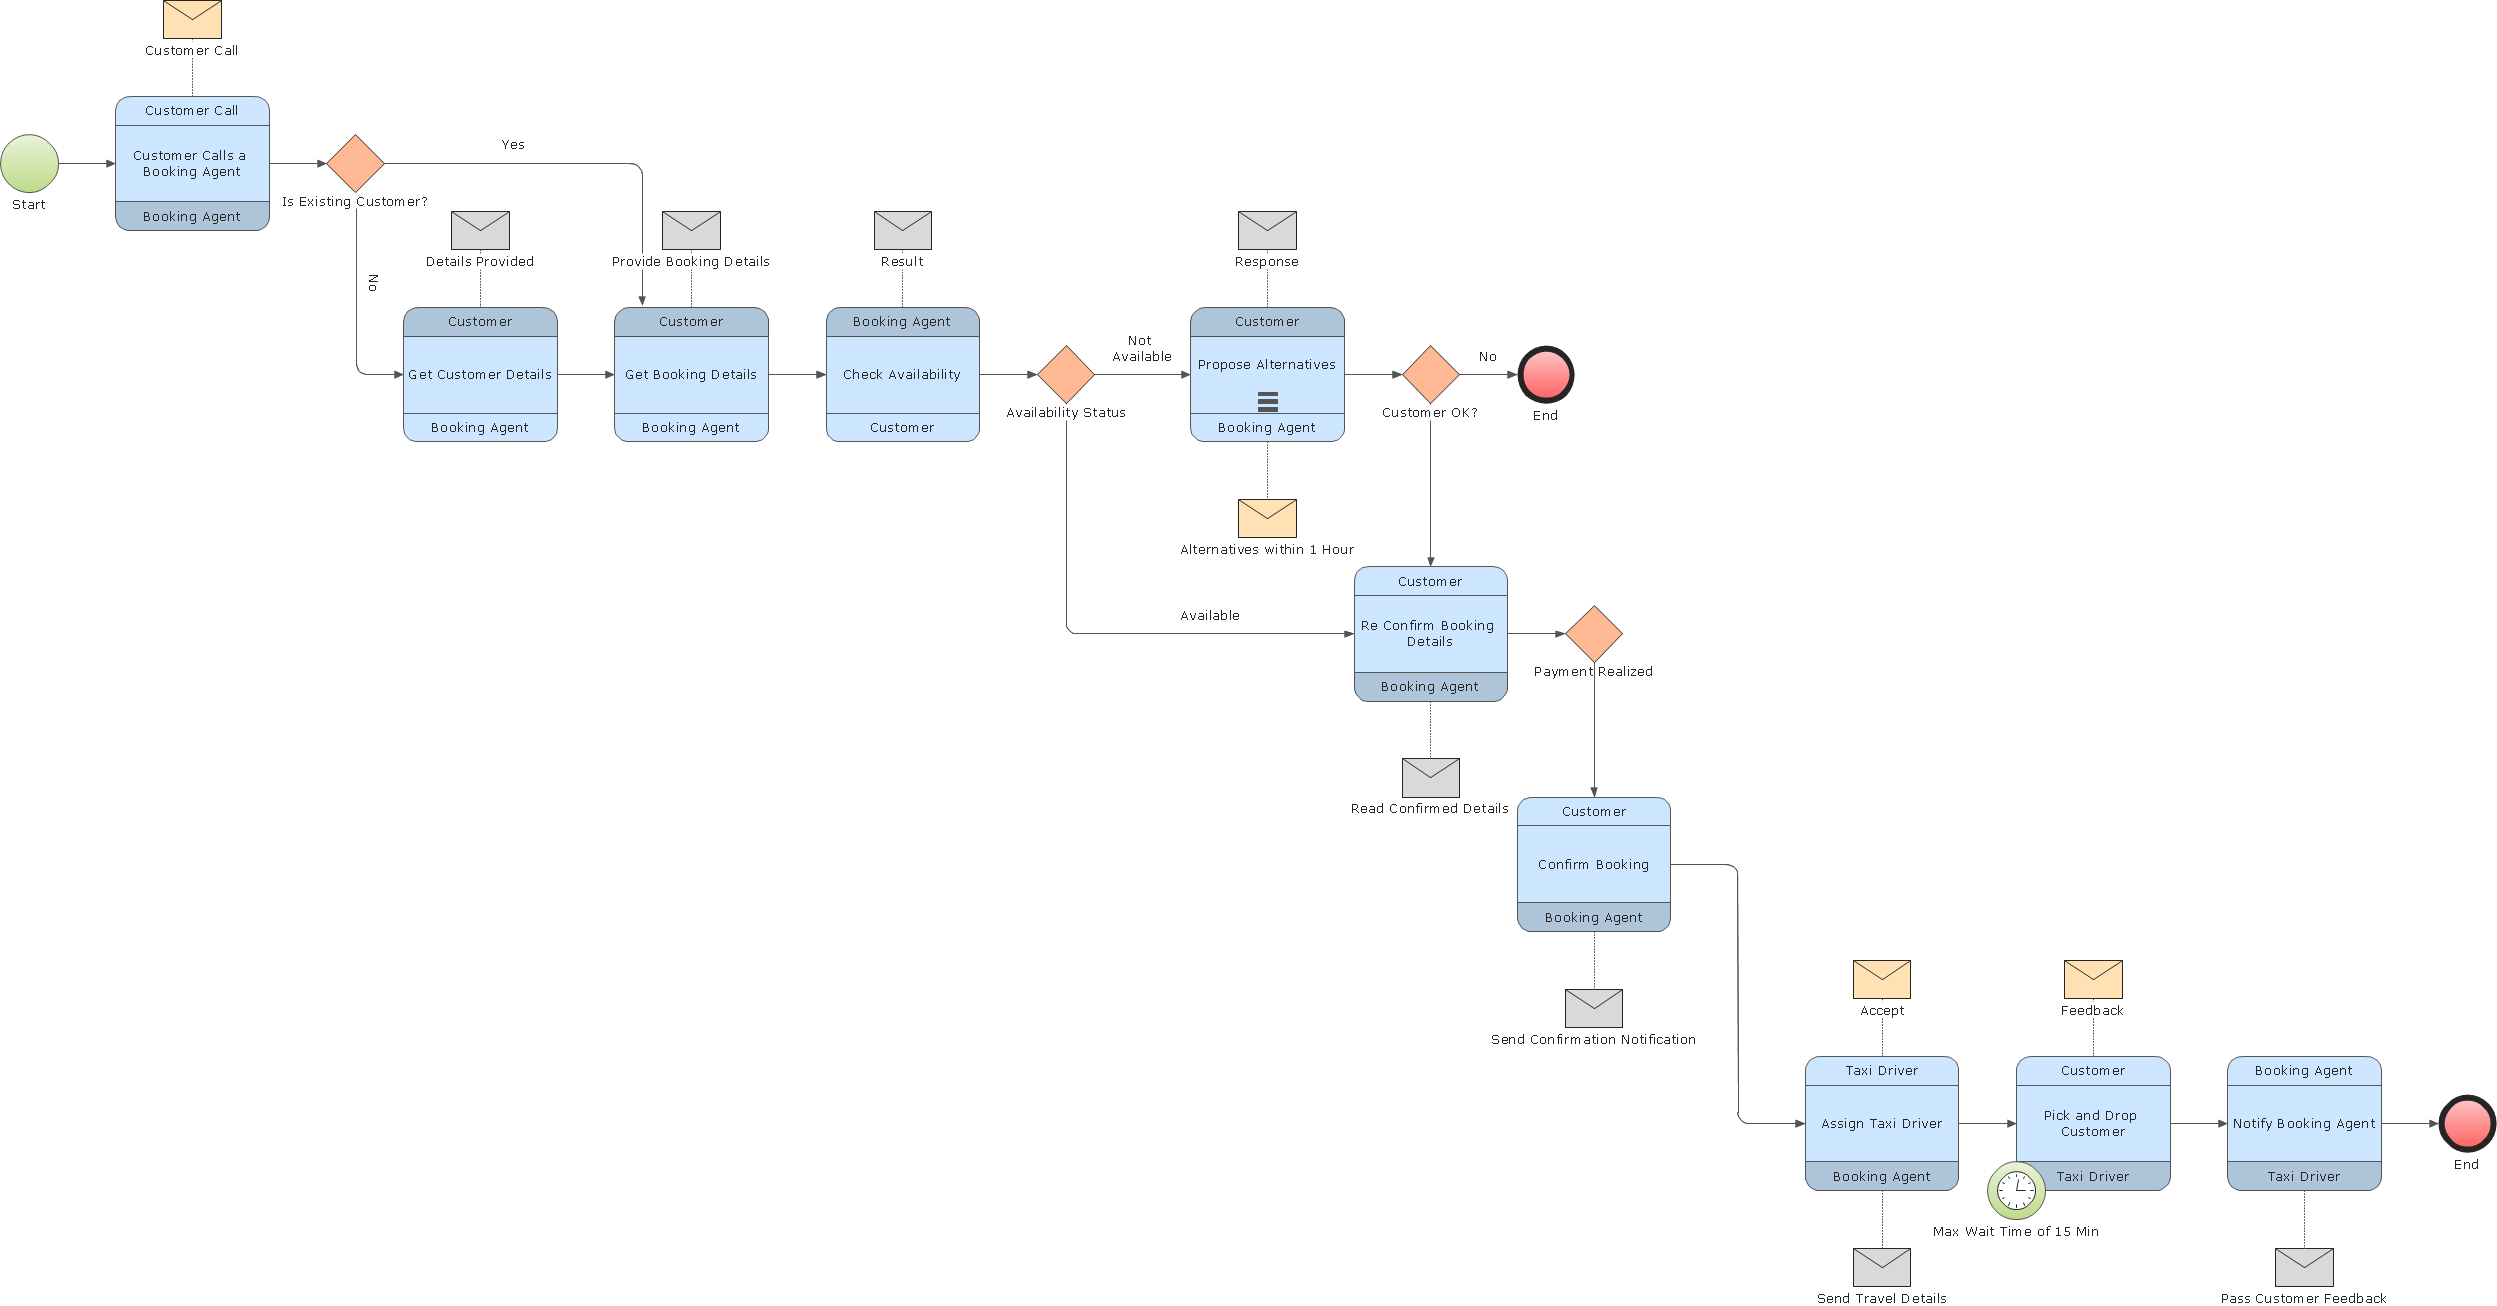
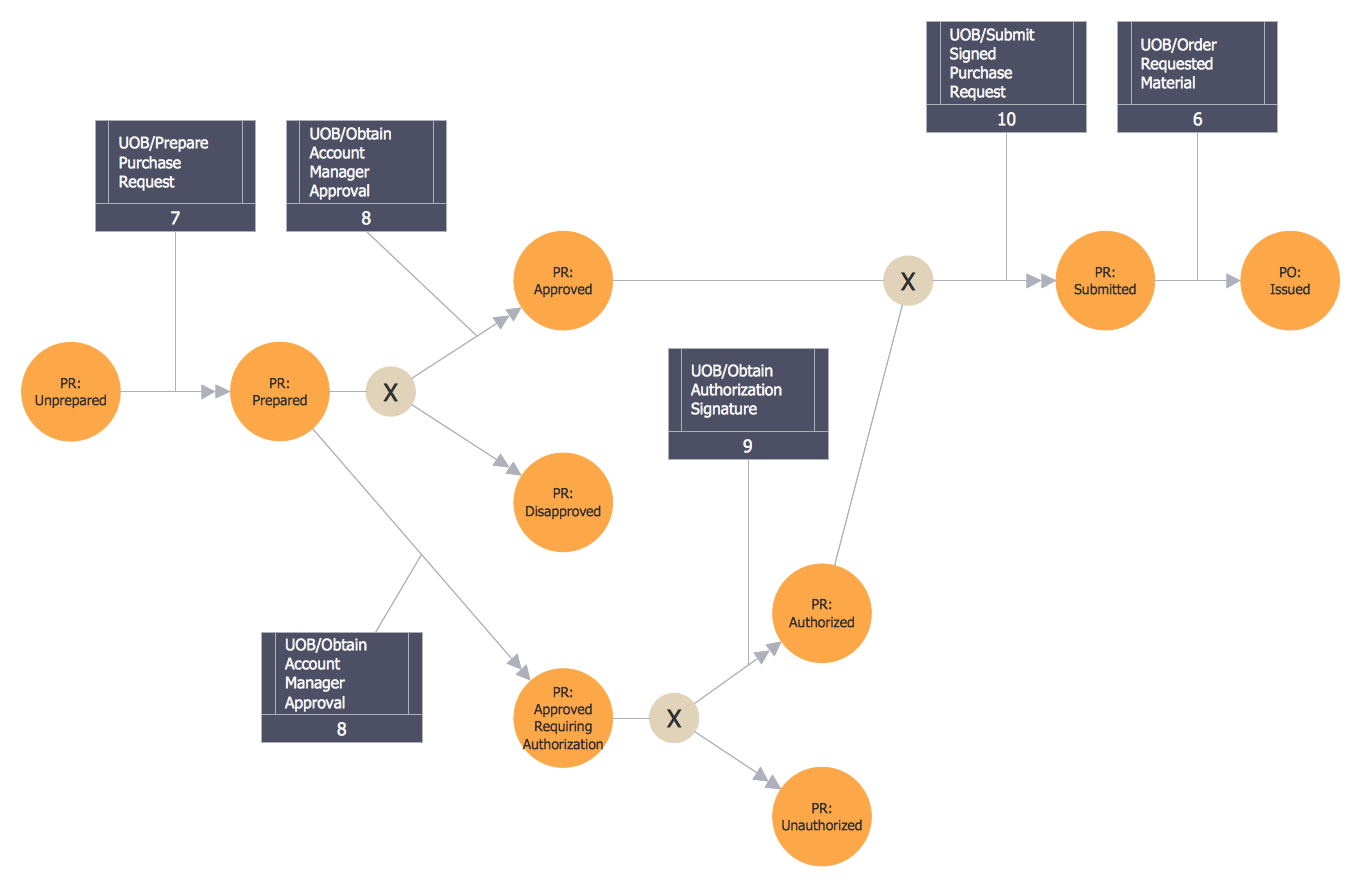
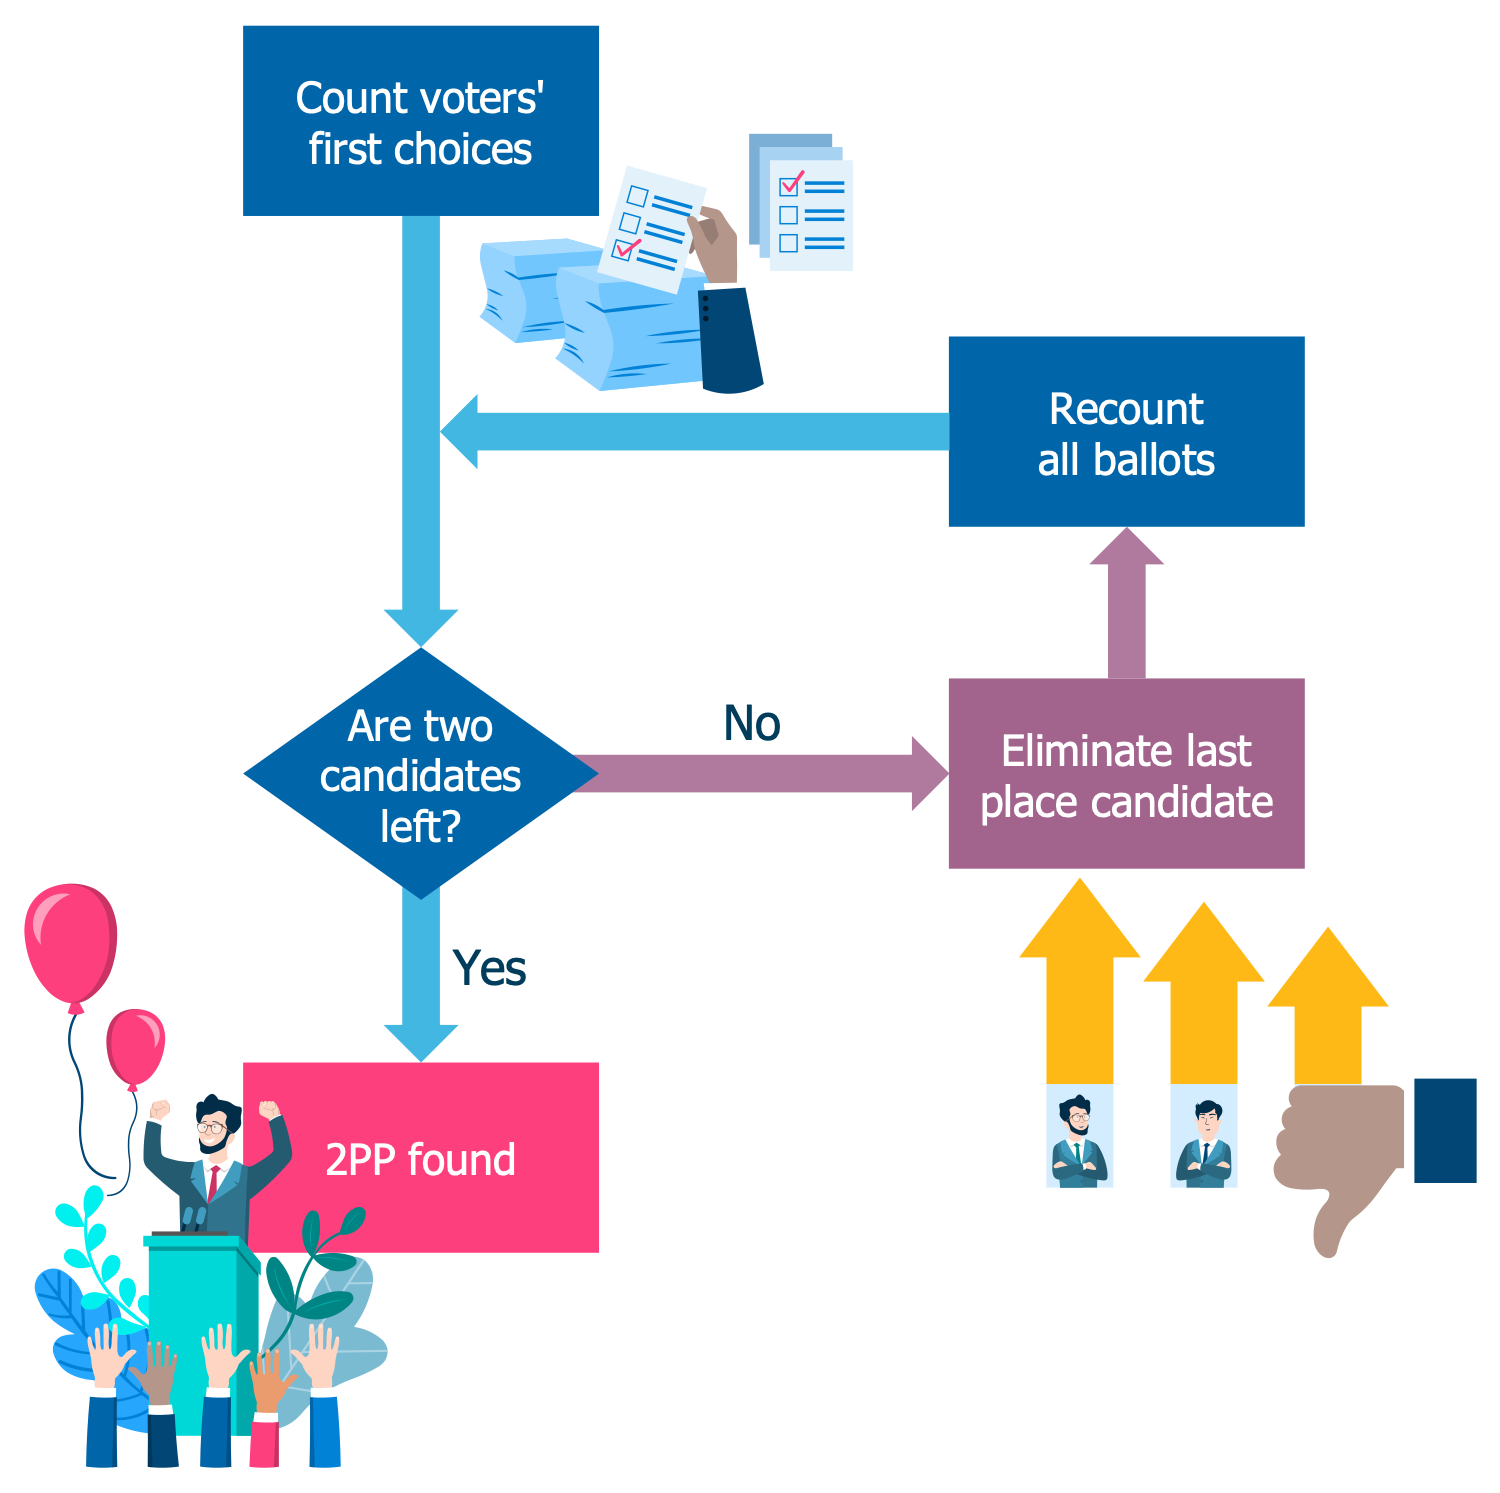
Example 2. Politics Infographics Solution - Libraries Design Elements
Use ConceptDraw DIAGRAM software and Politics Infographics solution from the ConceptDraw Solution Park to present easily the schedules of political polls and their results. Make your political infographics attractive with colorful clipart included in solution libraries. 8 libraries of pre-made vector design elements - political people, election, civil society, and more and collection of Politics Infographics samples will be helpful for you.

Example 3. Politics Infographics Solution in ConceptDraw STORE
The infographics you see on this page were created in ConceptDraw DIAGRAM software using the Politics Infographics Solution and its pre-made pictograms and clipart. They successfully demonstrate the solution's capabilities and professional results you can achieve. An experienced user spent 10-15 minutes creating each of these samples.
Use the powerful tools of the Politics Infographics Solution for ConceptDraw DIAGRAM software to create your own infographics and diagrams of any complexity fast and easy, and then successfully use them in your work and personal activity.
All source documents are vector graphic documents. They are available for reviewing, modifying, or converting to a variety of formats (PDF file, MS PowerPoint, MS Visio, and many more graphic formats) from the ConceptDraw STORE. The Politics Infographics Solution is available for all ConceptDraw DIAGRAM users.