ConceptDraw solution Computer and Networks provides Interactive Voice Response samples, templates and library of 35 vector stencils for drawing the IVR network diagrams.
Use ConceptDraw DIAGRAM diagramming and vector drawing software enhanced with solution Computer and Networks to visualize the logical and physical structure of IVR systems for inbound and outbound call centers and voice mail systems.
NINE RELATED HOW TO's:
What is the ideal GUI interface? The interface of mobile device it's all that users see on it and can interact - screen, bars, icons of applications. So the interface is the first that draws the user's attention. The main goal of software engineers, GUI interface designers, and GUI developers is to make the interface first of all easy for perception and understanding, convenient and attractive for the users. The iPhone's GUI interface meets all these requirements.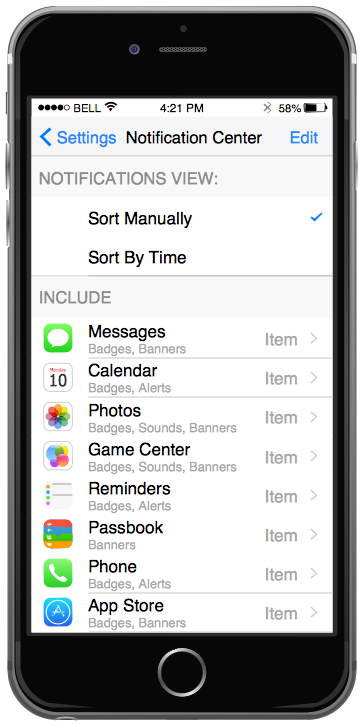
Picture: GUI Interface
Related Solution:
ConceptDraw is rapid and powerful network diagram drawing software with rich examples, templates, design objects and stencils.
Picture: Draw Network Diagram based on Templates and Examples
Wireless computer network diagrams help system administrators and network engineers to find out amount and type of equipment needed for each office WLAN.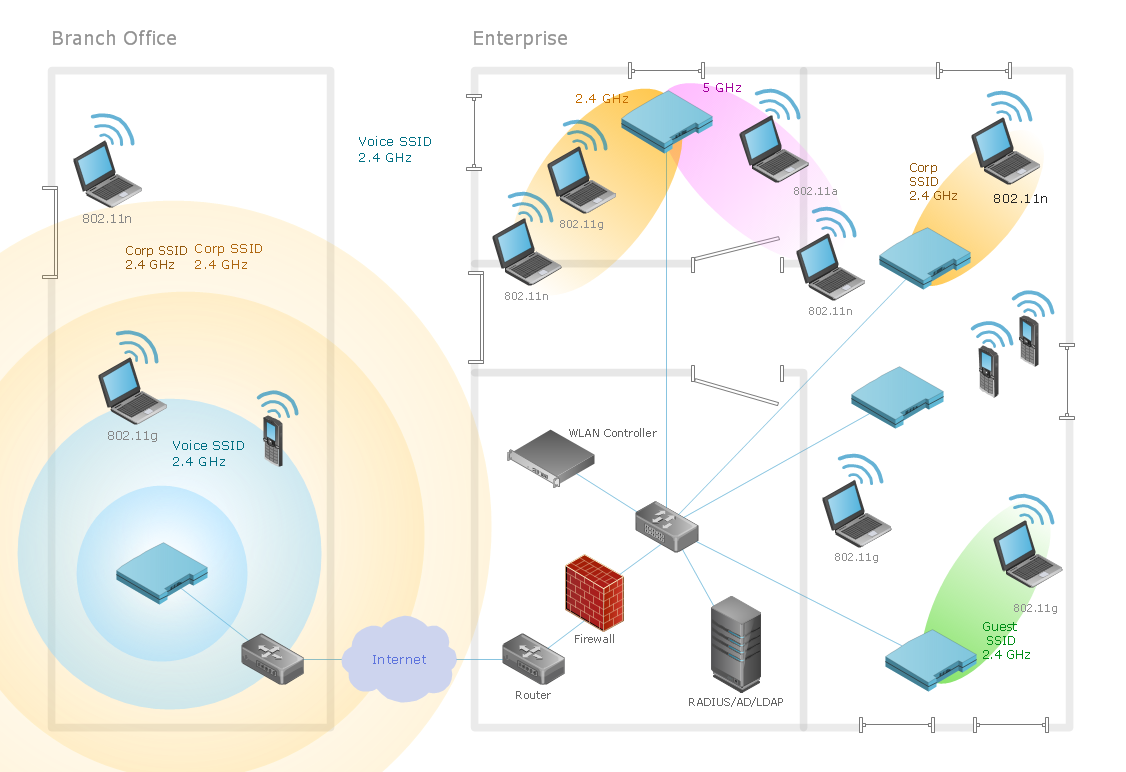
Picture: Find out what amount and type of equipment is needed for your office network
Related Solution:
Local area network connects computers and other network appliances within an area, such as office building or a campus. It can be difficult to provide such network without a predesigned plan. For these purposes you can use network diagram software, which helps you to create LAN network diagrams and office network diagrams quickly and effortless. This will speed up your work and you can save the diagram for the future network improvements.
The following diagram illustrates a network topology of the small office. LAN configuration has a star topology. The local network joins 8 computers among which are several desktop PCs, laptop, two iMacs and iBook. The end-point devices are divided into three groups. Each group is connected to its hub. There is a network printer and a modem, which are interconnected with other devices through a network server. Each computer on the LAN can access the server through a corresponding hub.
Picture: Network Diagram Software. LAN Network Diagrams. Physical Office Network Diagrams
Related Solution:
The ConceptDraw vector stencils library Cisco People contains symbols for drawing the computer network diagrams.
Vector stencils library Cisco People contains 17 pictogram symbols and clipart for drawing the computer network diagrams using the ConceptDraw DIAGRAM diagramming and vector drawing software.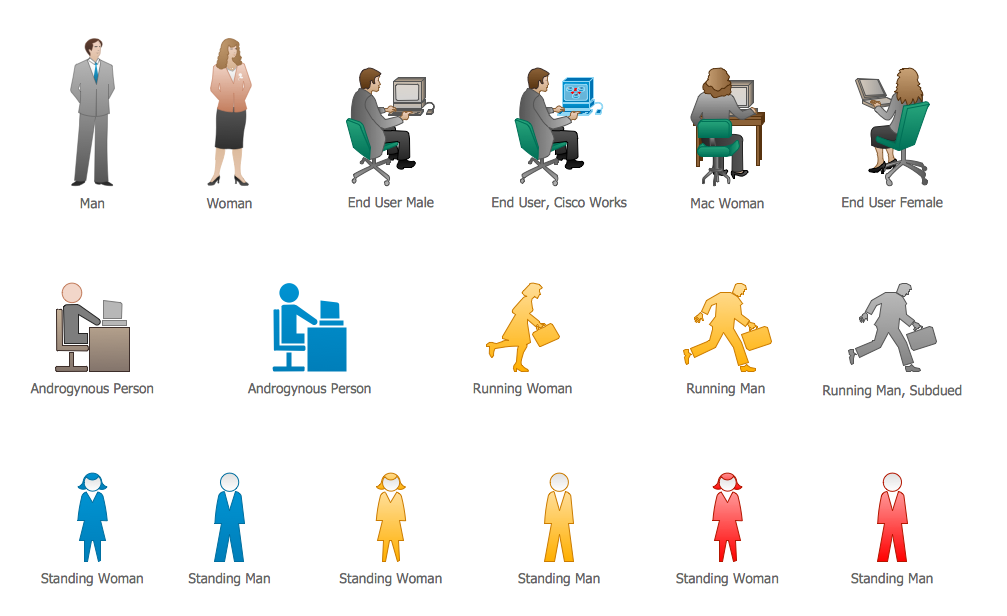
Picture: Cisco People. Cisco icons, shapes, stencils and symbols
Related Solution:
Data flow diagrams are the graphical tool, used in the visualization of data flow of some data processing systems. It is the valuable process modeling tool. Also designing DFD is the important component of the initial part of any information system development project. The standard symbols are used to represent the interaction of a system components and how various kinds of components influence on data flow. The ConceptDraw Data Flow Diagrams solution is design to assist professional software engineers in making DFDs according to Gane and Sarson, and Yourdon and Coad notations.
Do you imagine yourself as a successful IT specialist? To your mind, they all use data flow diagram examples to learn and to get inspired. Aren’t you still with us?
Picture: Data Flow Diagram Examples
Related Solution:
Wireless Network solution contains template, library and a set of design elements that help network engineers visualize Wireless Network. Network engineers and designers use this solution to design, create and illustrate the wireless networks.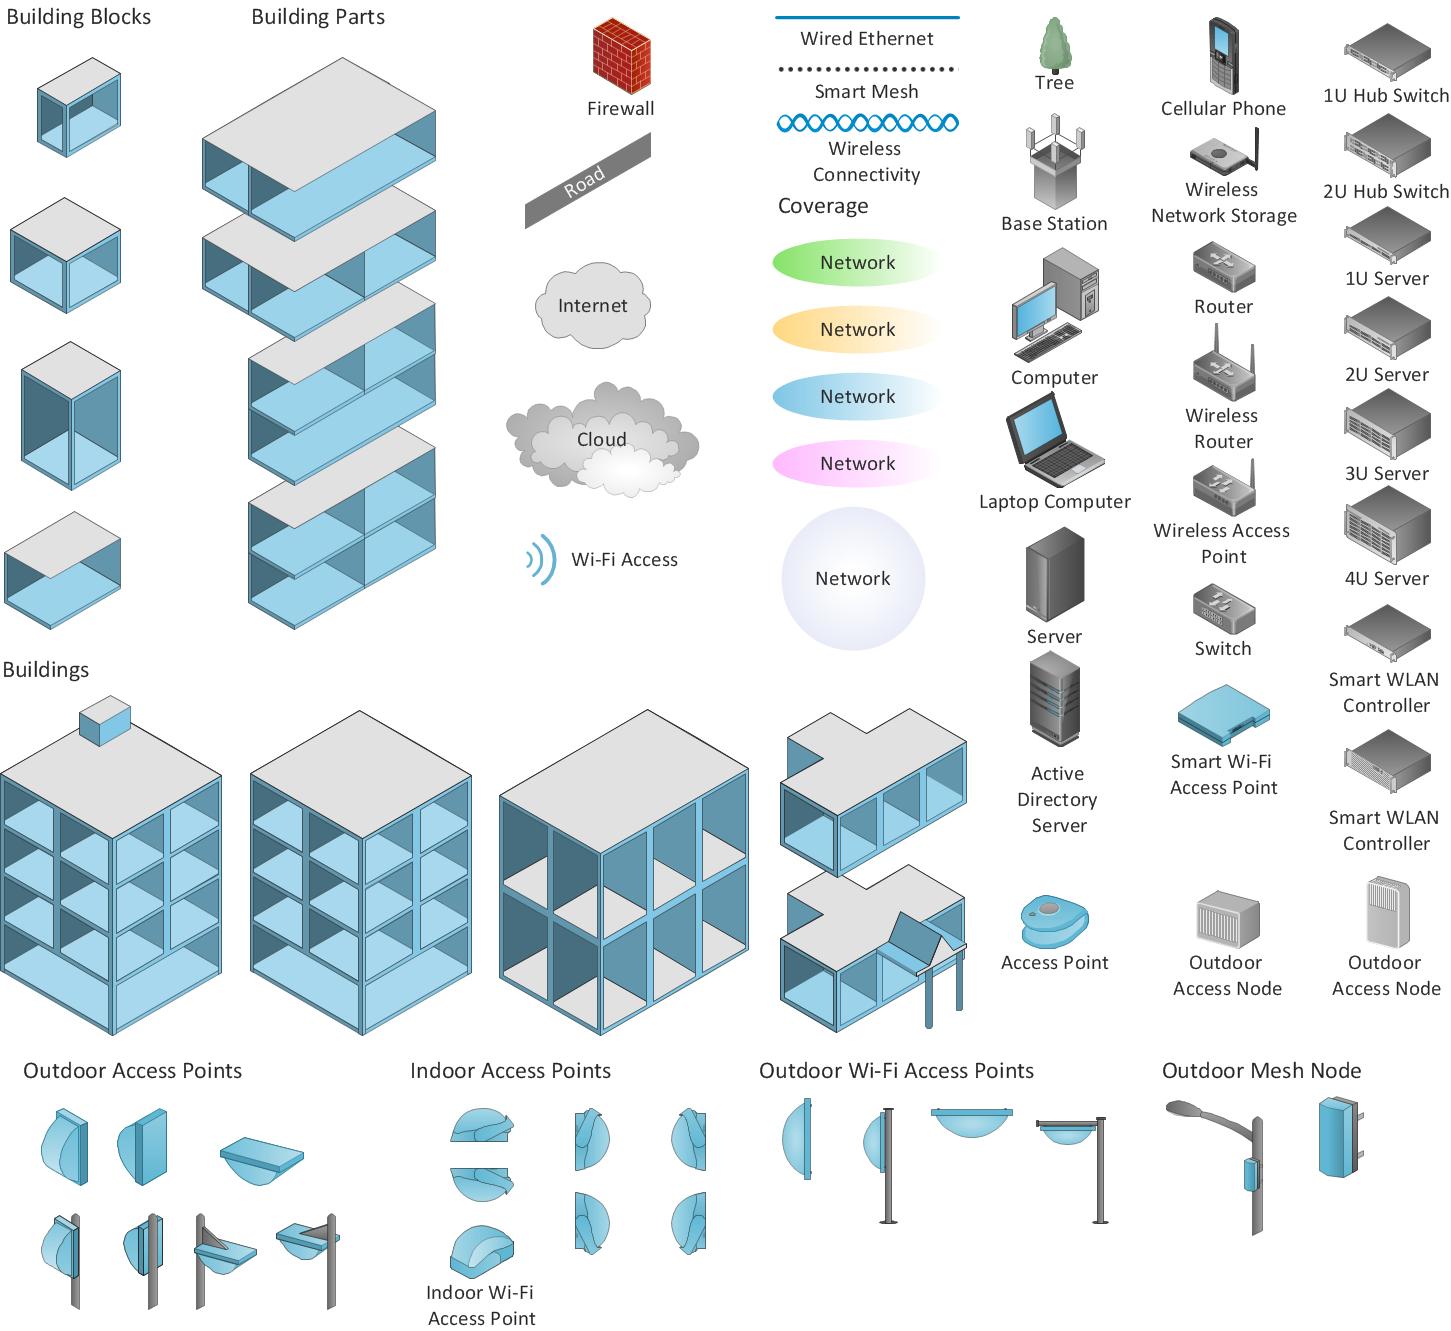
Picture: ConceptDraw DIAGRAM is an Advanced tool for Professional Network Diagrams Creation
Related Solution:
Interactive Voice Response (IVR) Network Diagram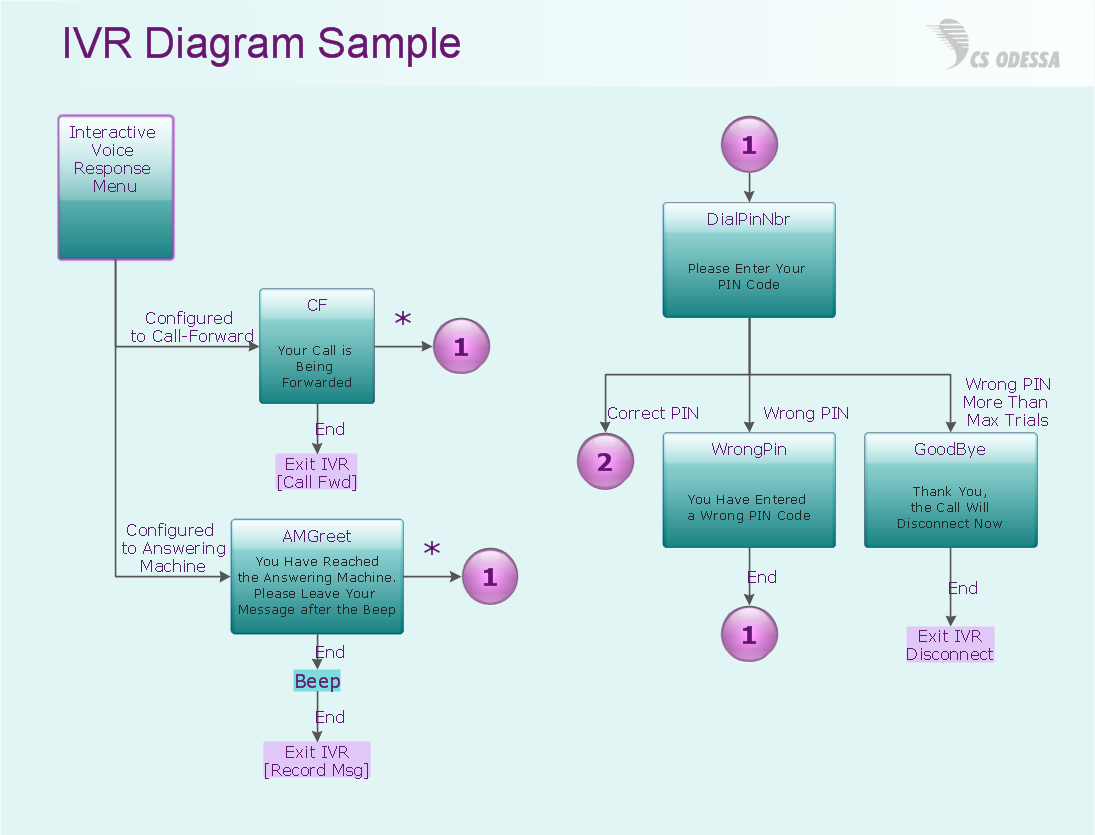
Picture: IVR Network Diagram
ConceptDraw solution Computer and Networks provides Interactive Voice Response samples, templates and library of 35 vector stencils for drawing the IVR network diagrams.
Use ConceptDraw DIAGRAM diagramming and vector drawing software enhanced with solution Computer and Networks to visualize the logical and physical structure of IVR systems for inbound and outbound call centers and voice mail systems.
Picture: Interactive Voice Response Network Diagram