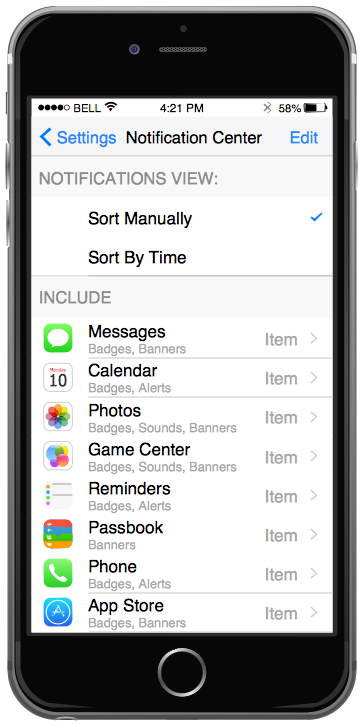
Example 1. iPhone GUI Interface - Settings Included Apps
The iPhone User Interface Solution from the Software Development Area for ConceptDraw Solution Park provides easy-to-use design drawing tools, large collection of different samples and templates of iPhone GUI Interfaces, and 9 libraries with great quantity of predesigned vector objects.

Example 2. iPhone GUI Interface — iPhone 6 Home Screen
It's very easy and timesaver to choose and drag the predesigned objects from the libraries, or change the ready sample or template for you needs.

Example 3. iPhone GUI Interface — Messages
You can select the desired iPhone mockup and drag also the interface filling - bars, icons, controls, and other elements and simply arrange them according to your taste. This can take just a few minutes.

Example 4. iPhone GUI Interface — Notification Center
The samples you see on this page were created in ConceptDraw DIAGRAM using the predesigned objects from the iPhone User Interface Solution libraries. An experienced user spent 10 minutes creating every of these samples.
Use iPhone User Interface solution to design your own GUI interfaces for iPhone applications quick, easy, and effective.
All source documents are vector graphic documents. They are available for reviewing, modifying, or converting to a variety of formats (PDF file, MS PowerPoint, MS Visio, and many other graphic formats) from the ConceptDraw STORE. The iPhone User Interface Solution is available for all ConceptDraw DIAGRAM or later users.
EIGHT RELATED HOW TO's:
ConceptDraw DIAGRAM extended with Windows 8 User Interface solution from the Software Development area is the best gui software. Using the drawing tools, libraries of vector objects, graphical user interface examples that offers Windows 8 User Interface solution, you will easily design the Windows 8 user interfaces and Windows 8 UI design patterns of any complexity.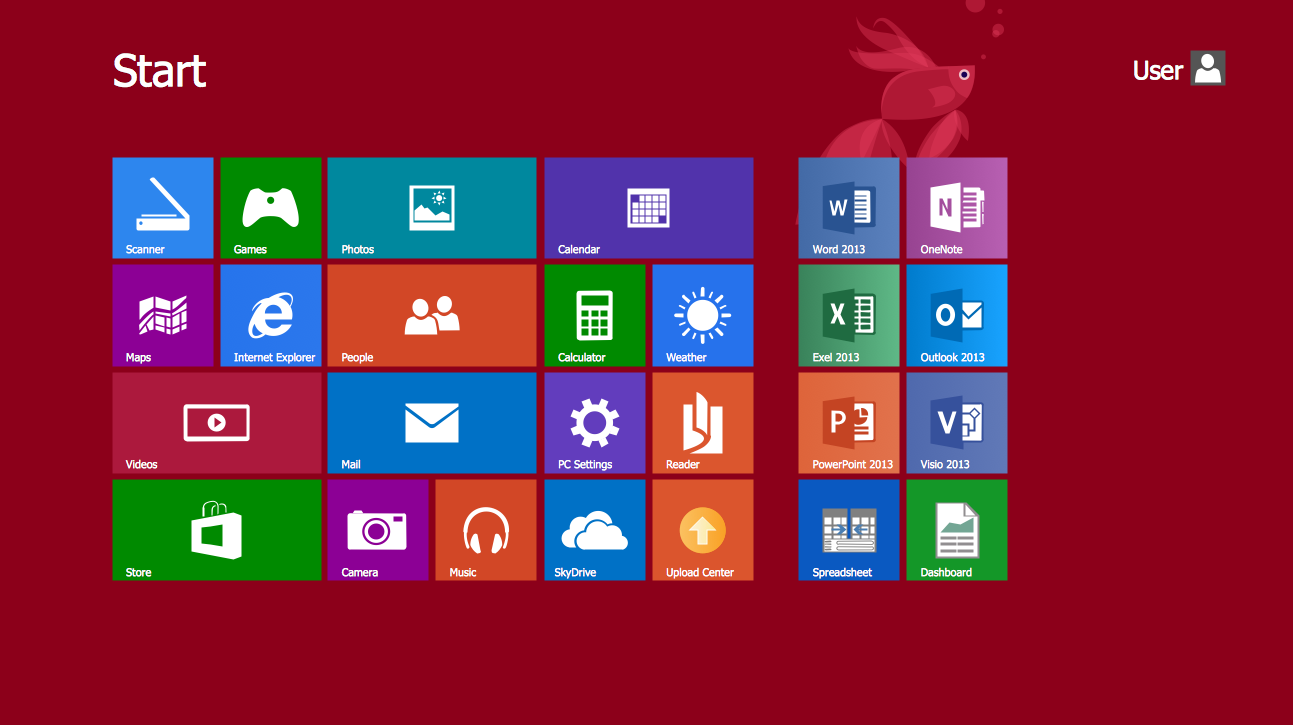
Picture: Graphical User Interface Examples
Related Solution:
The patterns are commonly used in the field of programming for various electronic devices, mobile devices and PCs. UI design patterns are useful standard solvings for common design problems. There are large quantity of various design and UI patterns.
Windows 8 is not exception - in the help to Win8 designers, developers, and software engineers, were developed the Windows 8 UI Design Patterns.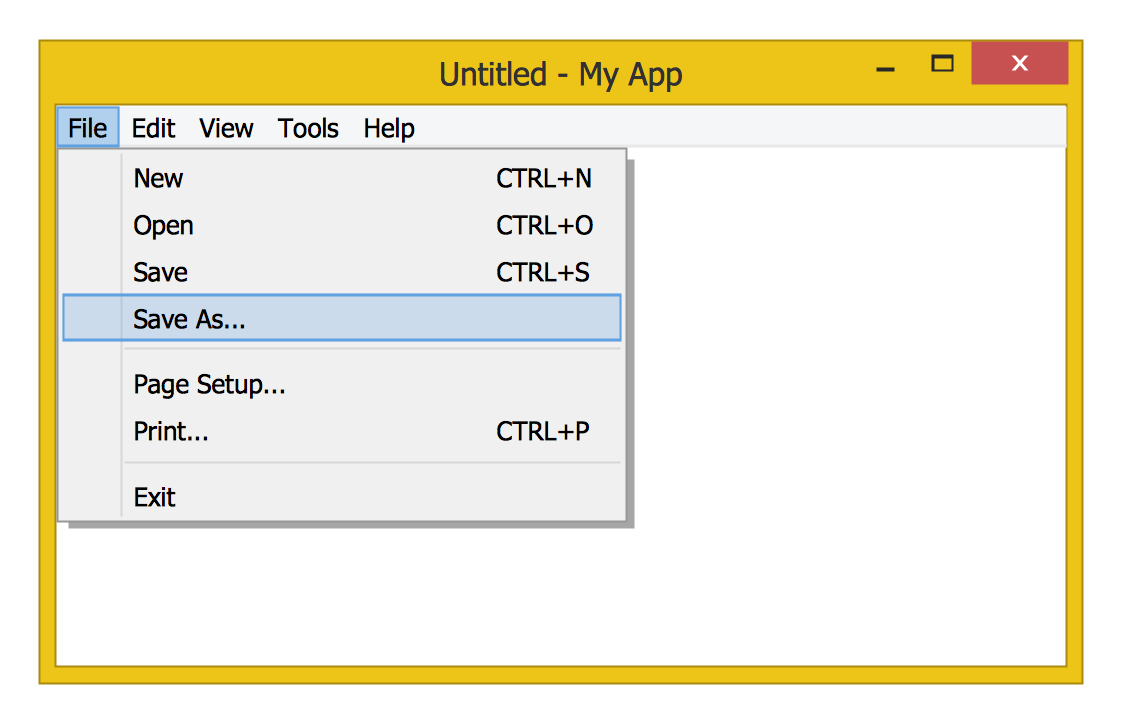
Picture: Windows 8 UI Design Patterns
Related Solution:
Information technologies rapidly develope in the modern world. The popularity of electronic and mobile devices is growing every day and entails the need for the new applications. Now the quantity of applications is incredibly large and every day increases, and thus the programming for mobile devices, and particularly the iPhone programming, is increasingly demanded. iPhones are ones of the most worldwide popular smartphones developed by Apple Inc.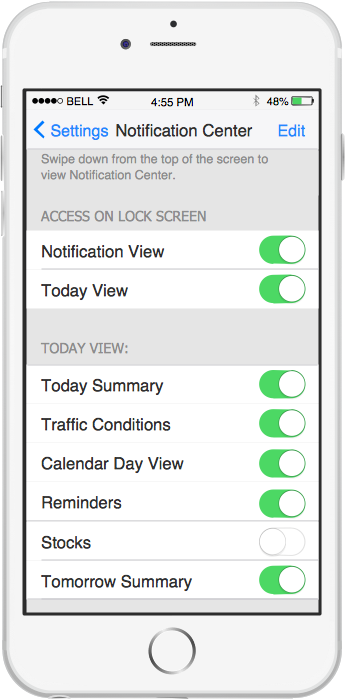
Picture: iPhone Programming
Related Solution:
ConceptDraw DIAGRAM is a powerful diagramming and vector drawing software. Extended with Windows 8 User Interface solution from the Software Development area, ConceptDraw DIAGRAM became the ideal software for prototype and design professional looking user interfaces for Windows 8 and Windows 8.1. Windows 8 User Interface solution offers you wide variety of user interface design examples, templates and samples.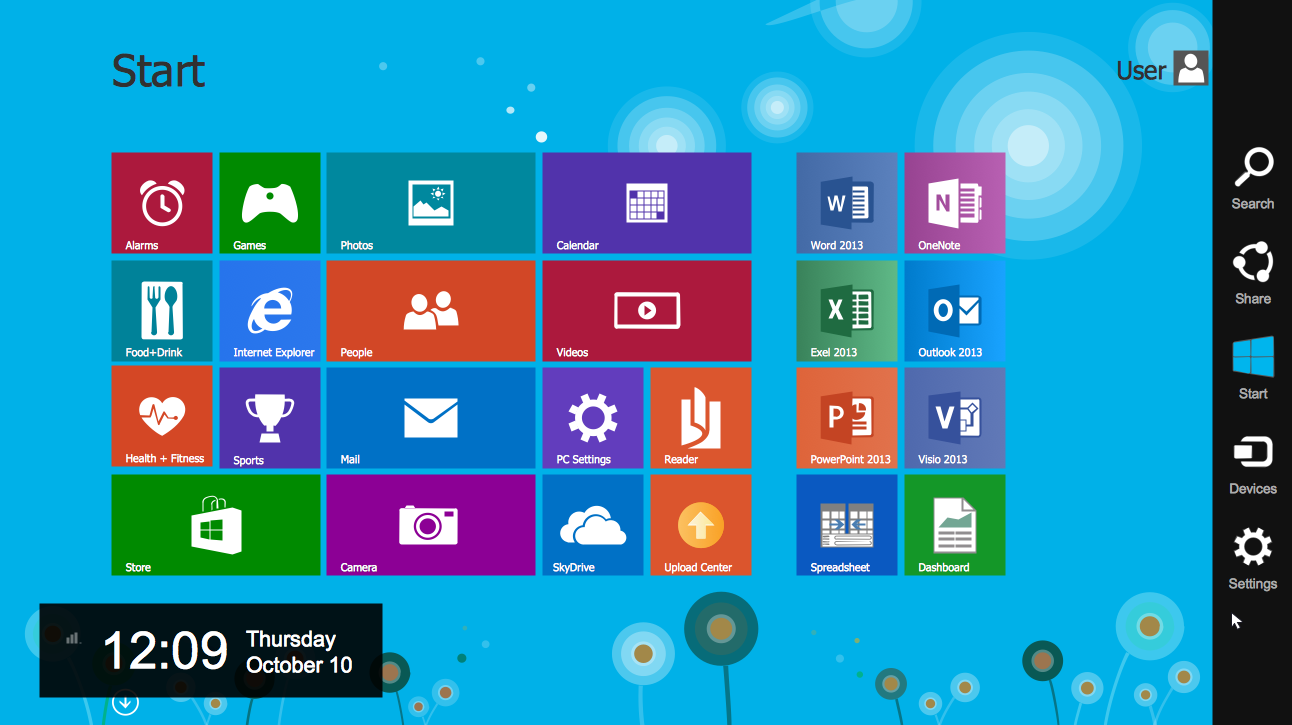
Picture: User Interface Design Examples
Related Solution:
iPhone is a worldwide popular line of smartphones designed and marketed by Apple Inc. First thing that you see taking up the iPhone is its design and interface. It's very important that interface will be convenient and easy to use on a mobile device. That is why every day designers make great efforts to make the really best iPhone interface.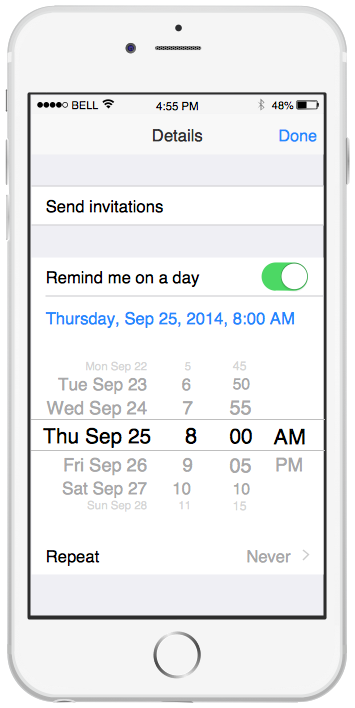
Picture: iPhone Interface
Related Solution:
ConceptDraw DIAGRAM diagramming and vector drawing software extended with Windows 8 User Interface Solution is a powerful GUI Software. Designing of professional looking Windows 8 and Windows 8.1 user interfaces, and Windows 8 UI design patterns never been easier than now with convenient and useful tools of Windows 8 User Interface Solution from the Software Development area.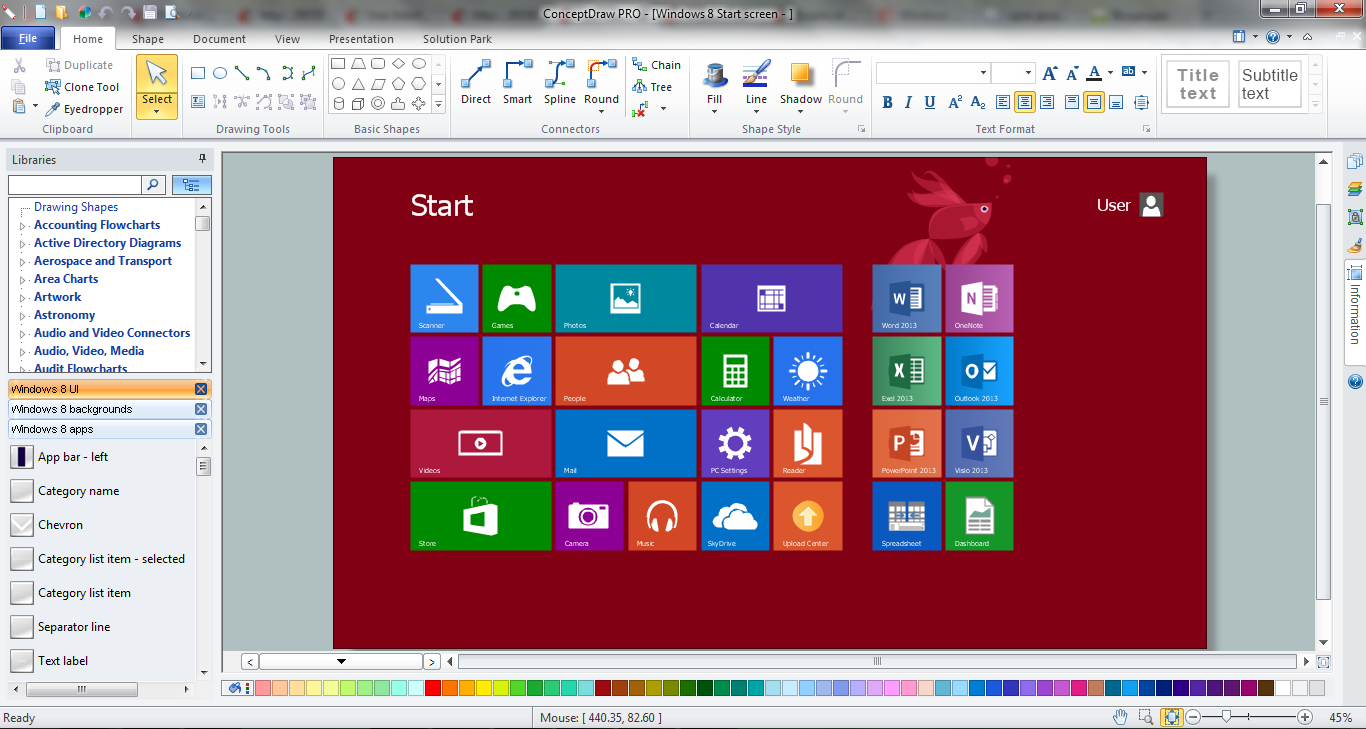
Picture: GUI Software
Related Solution:
ConceptDraw DIAGRAM diagramming and vector drawing software extended with Mac OS User Interface Solution from the Software Development area is a powerful Mac OS GUI Software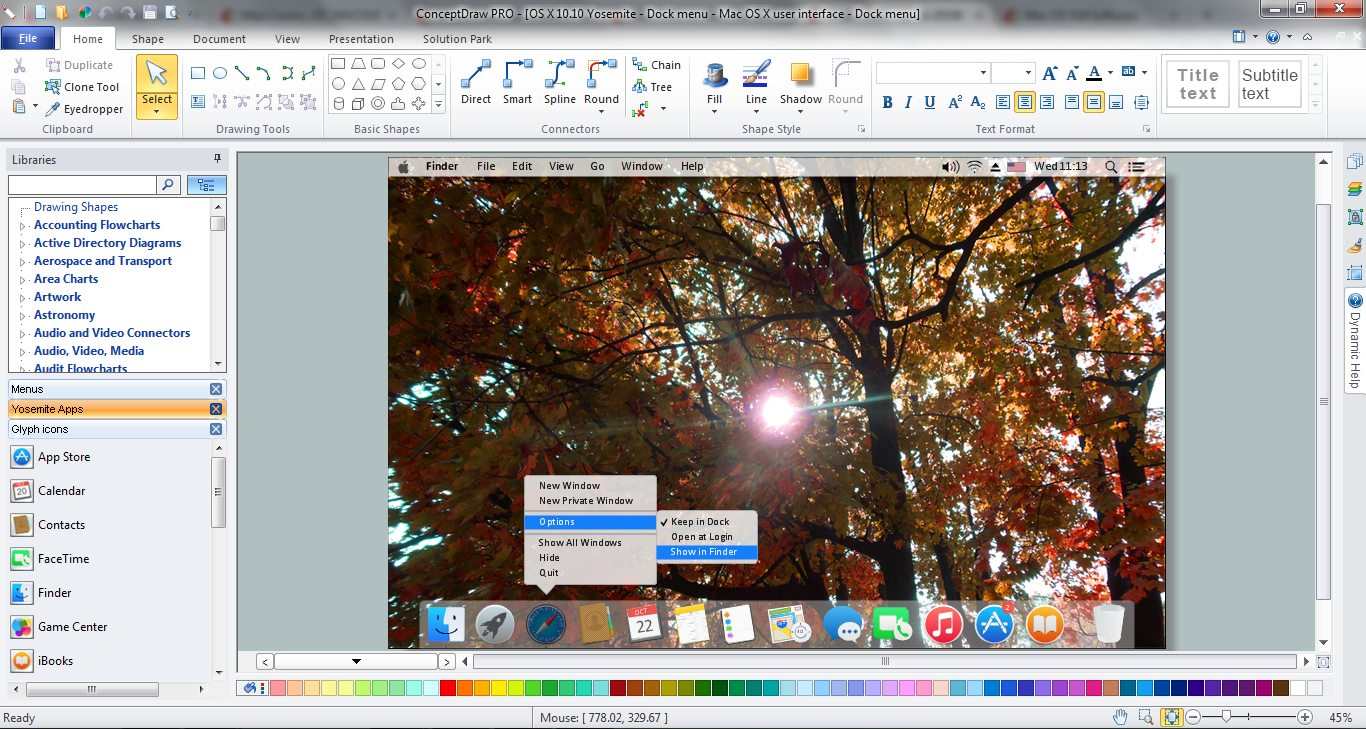
Picture: Mac OS GUI Software
Related Solution:
Android is an operating system based on the Linux kernel and developed by Google for smartphones, tablet computers, electronic books, netbooks, smartbooks, digital players, watches, game consoles, TV and other devices.
ConceptDraw DIAGRAM extended with Android User Interface Solution from the Software Development Area is a powerful software with extensive drawing tools which can help you to build the intelligible, attractive and easy for perception Android GUI for your application.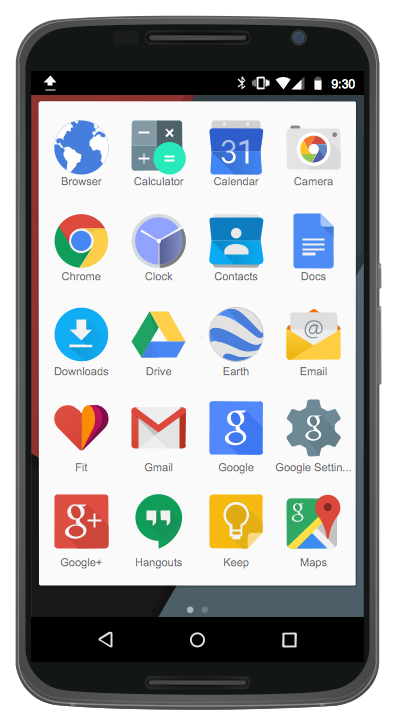
Picture: Android GUI
Related Solution:


