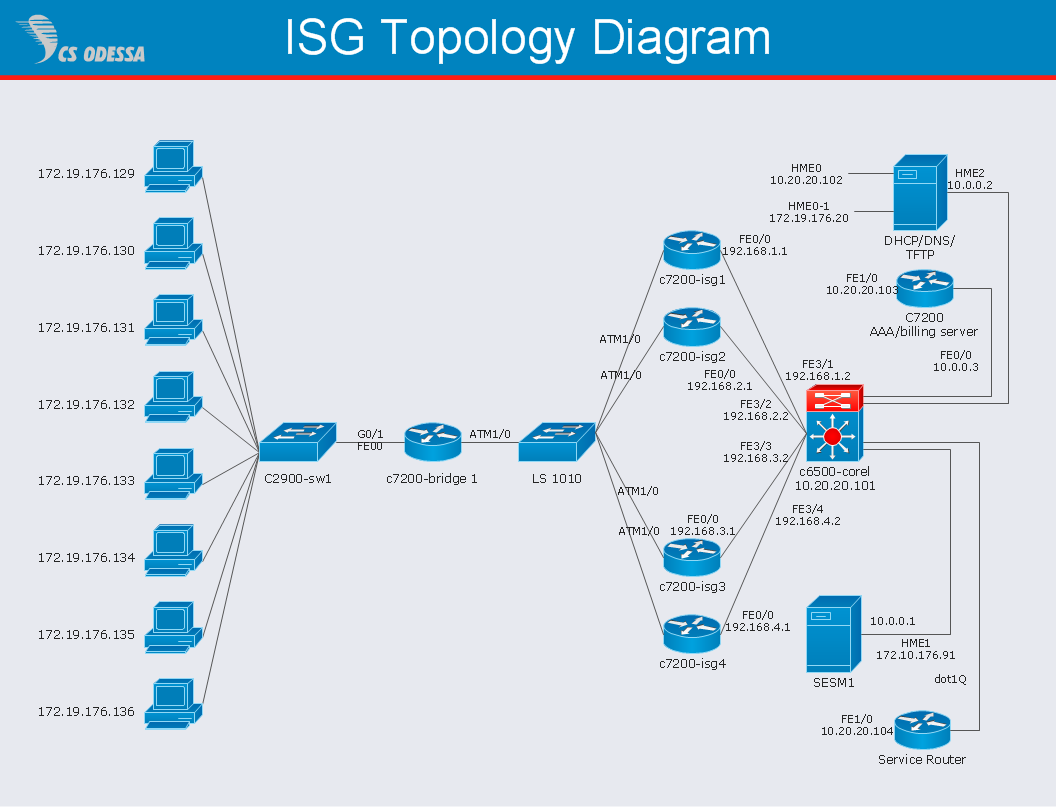
This Cisco ISG topology network diagram sample is created using ConceptDraw DIAGRAM diagramming and vector drawing software enhanced with Computer & Networks solution from ConceptDraw Solution Park.
Computer & Networks solution provides templates, samples and libraries of symbols for diagrams of computer networks that use integrated security gateways (ISG) for virtual private networking (VPN), firewall and network monitoring.
TEN RELATED HOW TO's:
ConceptDraw DIAGRAM diagramming and vector drawing software extended with Computer Network Diagrams Solution from the Computer and Networks Area offers a set of useful tools, collection of templates, samples, and libraries of various computer symbols, computer devices icons, computer network icon for fast and easy drawing network computer diagrams and illustrations.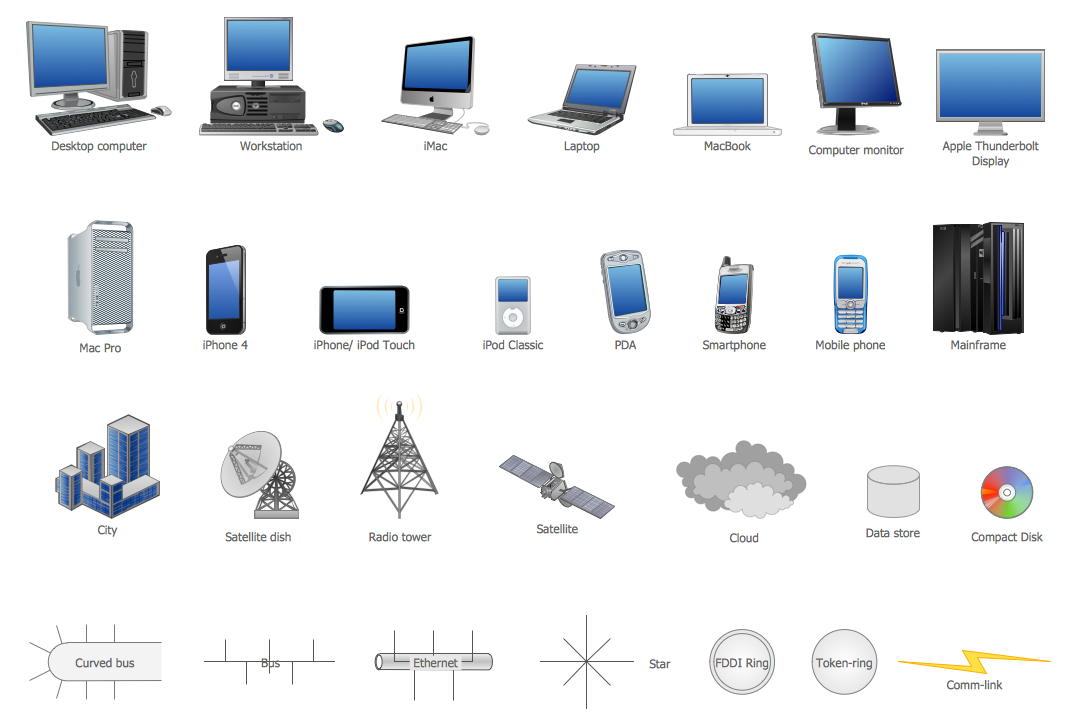
Picture: Network Icon
Related Solution:
Closed-circuit television (CCTV) uses cameras and monitors to carry out video surveillance. Unlike broadcast television this system has only local signal. It is a feature of almost every video camera, yet CCTV is mainly a system for visual control of certain areas such as banks, airports, supermarkets, and other places for security reasons.
Developing and installing CCTV system is a time-consuming process. It also requires certain knowledge and skills. ConceptDraw is a solution of setting video cameras rationally. You can achieve two aims at once: CCTV Design Tool saves your time and your money and helps you make professional video surveillance system.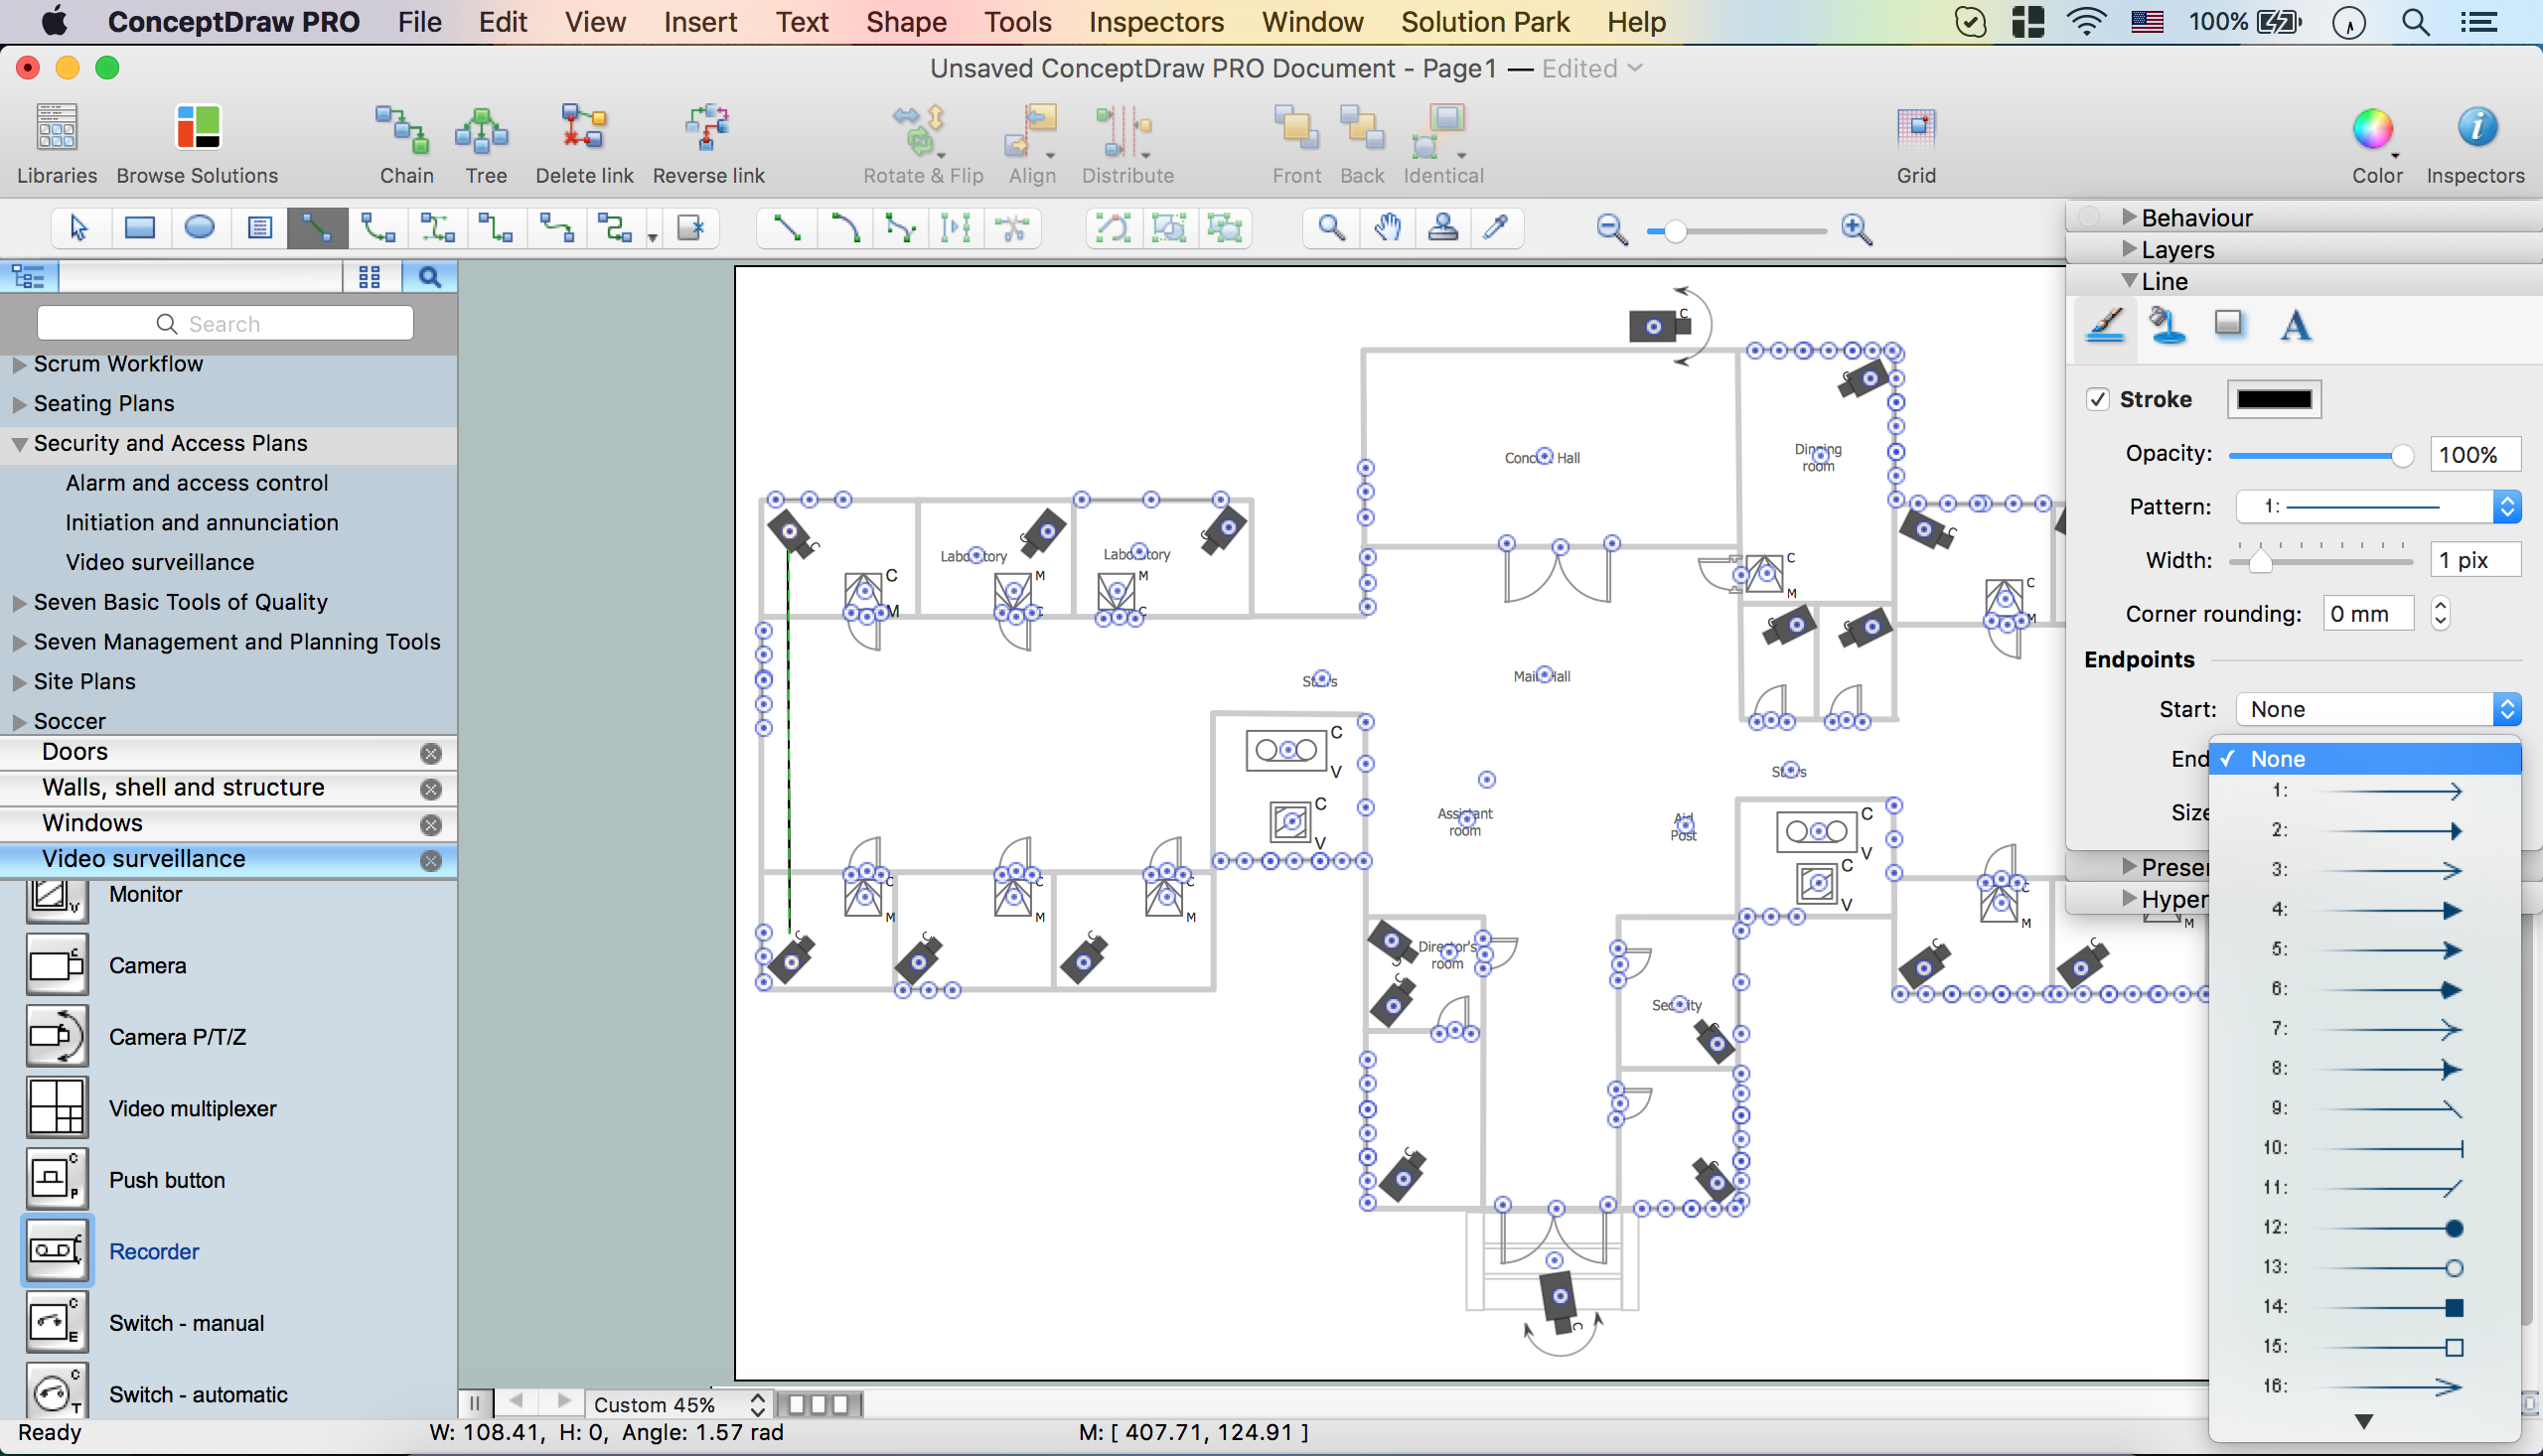
Picture: How To Create CCTV Network Diagram
Related Solutions:
Developing a corporate network starts from choosing equipment such as servers or routers. You should choose a topology for your network depending on your needs and budget. Thus, a star topology is cheap to implement, and mesh topology, for instance, is more reliable.
This network diagram illustrates various types of computer network diagrams. Here one can find out the samples of Star, Ring, common Bus and even a rather rare fully connected network topologies. This diverse array of diagrams was created using the ConceptDraw DIAGRAM software and its solution designed especially for computer networking: design and documenting. There are more than 2 thousands graphical symbols of network equipment in the solution's vector libraries. You can create a diagram of any type network, containing any equipment and connections - no matter is it the most ancient or the super-modern network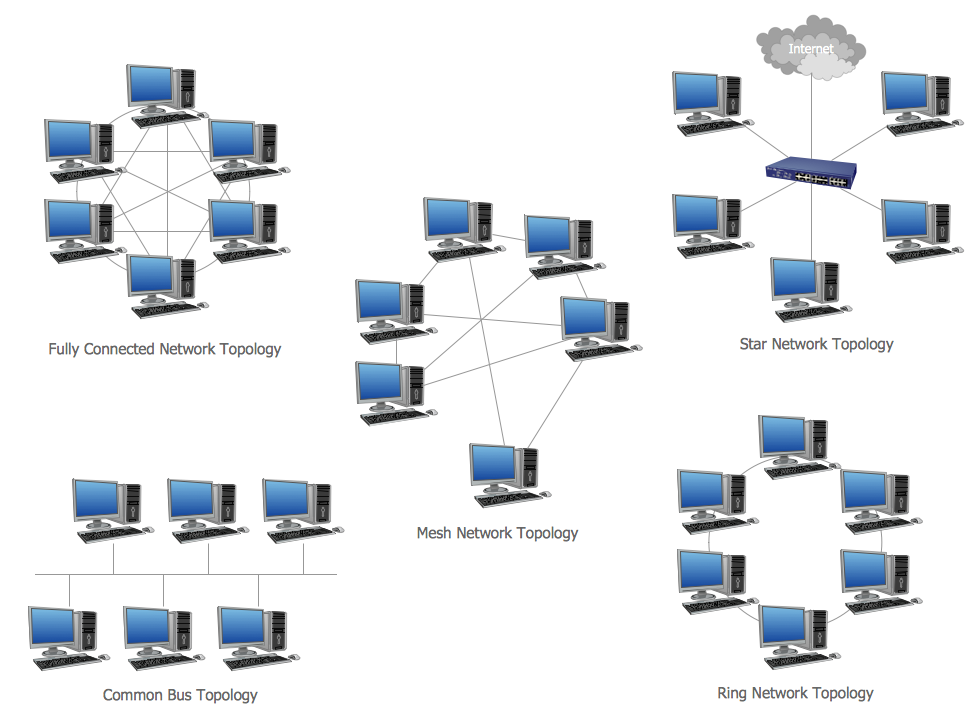
Picture: Network Topology
Related Solution:
Use Case Diagrams describes the functionality provided by a system in terms of actors, their goals represented as use cases, and any dependencies among those use cases.
Picture: Diagramming Software for Design UML Use Case Diagrams
This sample was created in ConceptDraw DIAGRAM diagramming and vector drawing software using the Computer and Networks solution from Computer and Networks area of ConceptDraw Solution Park.
This is example of the Toroidal network topology
Network topology is the topological structure of the computer network.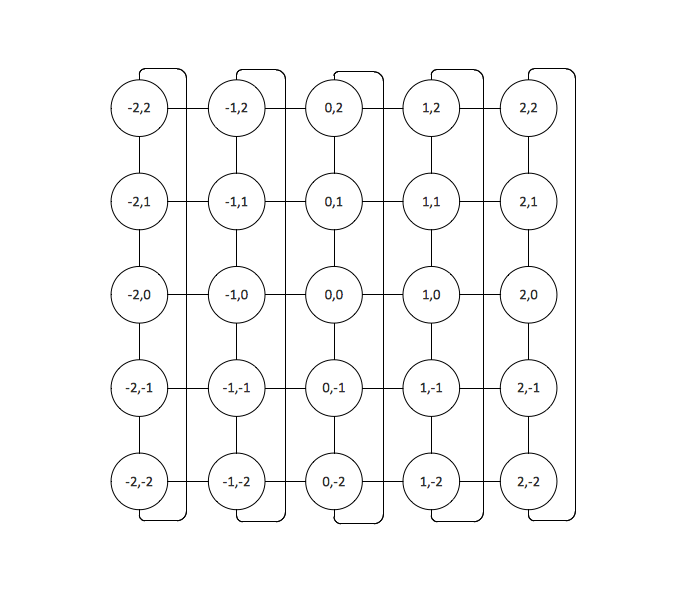
Picture: Toroidal Network Topology
Related Solution:
The Total Quality Management Diagram solution helps you and your organization visualize business and industrial processes. Create Total Quality Management diagrams for business process with ConceptDraw software.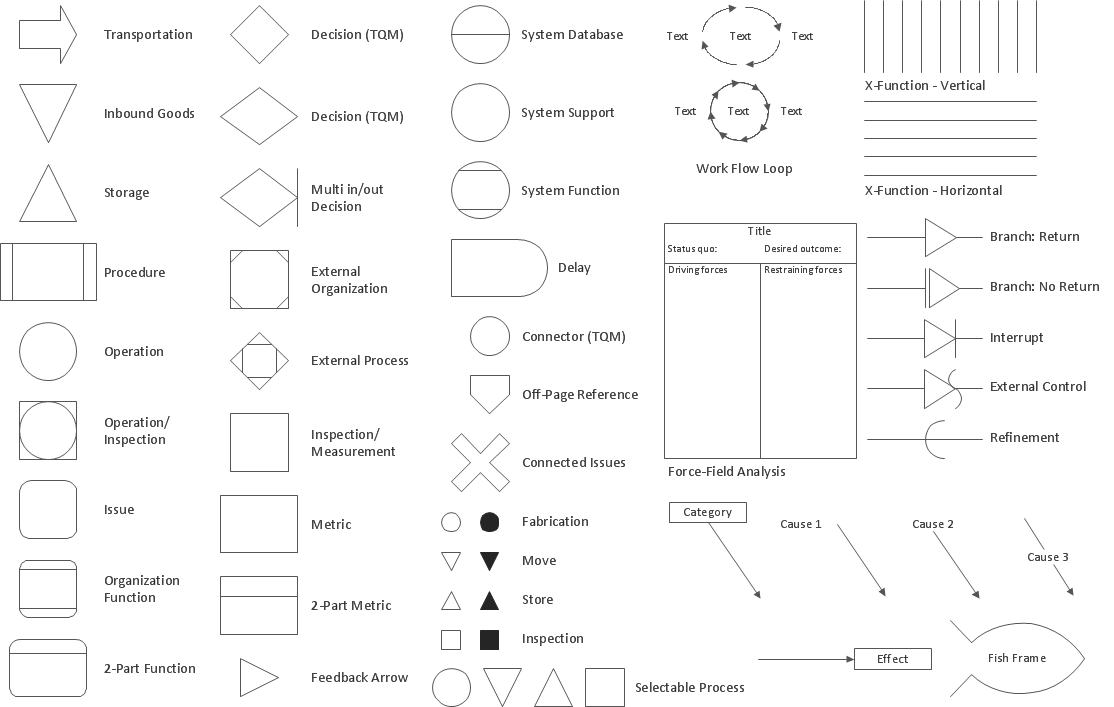
Picture: Total Quality Management Density
Related Solution:
For those who want to know what is a cross functional flowchart and how to draw it, we preared a special library and professional looking templates.
Take all the advantage of your drawing software to learn and create such a well-designed flowcharts.
Watch the HowTo video to learn more.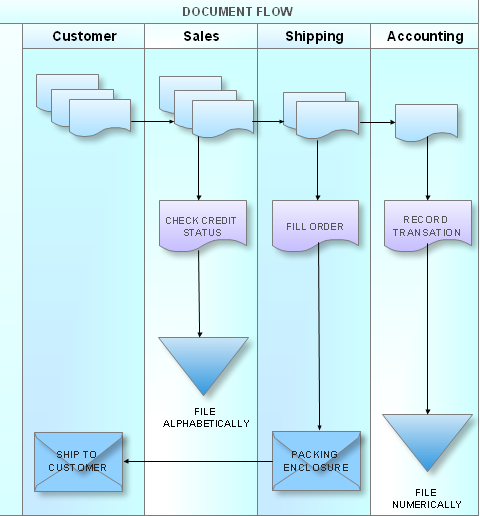
Picture: What is a Cross Functional Flow Chart?
ConceptDraw DIAGRAM is perfect for software designers and software developers who need to draw Network Layout Diagrams..png)
Picture: Design Element: Network Layoutfor Network Diagrams
The ConceptDraw vector stencils library Cisco Media contains symbols for drawing the computer network diagrams.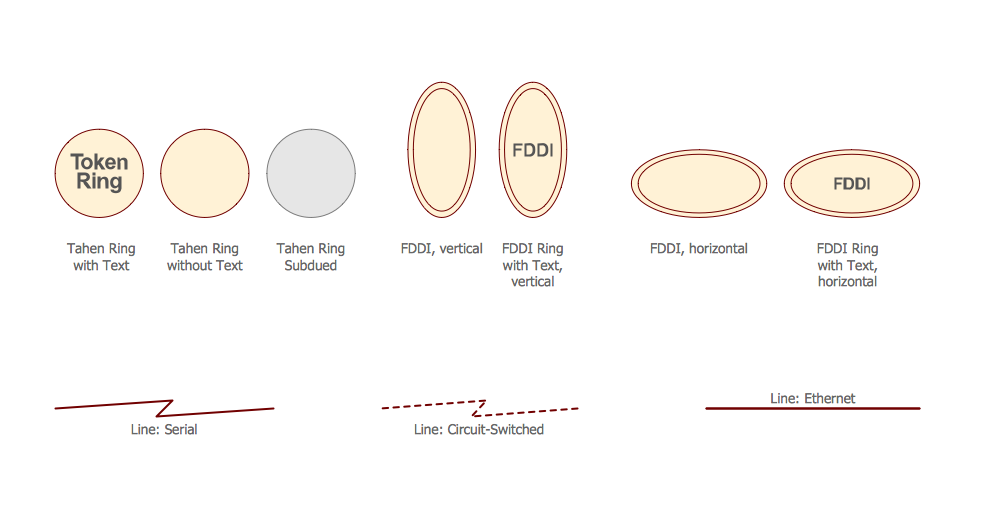
Picture: Cisco Media. Cisco icons, shapes, stencils and symbols
Related Solution:
The ConceptDraw vector stencils library Cisco Optical contains symbols for drawing the computer network diagrams.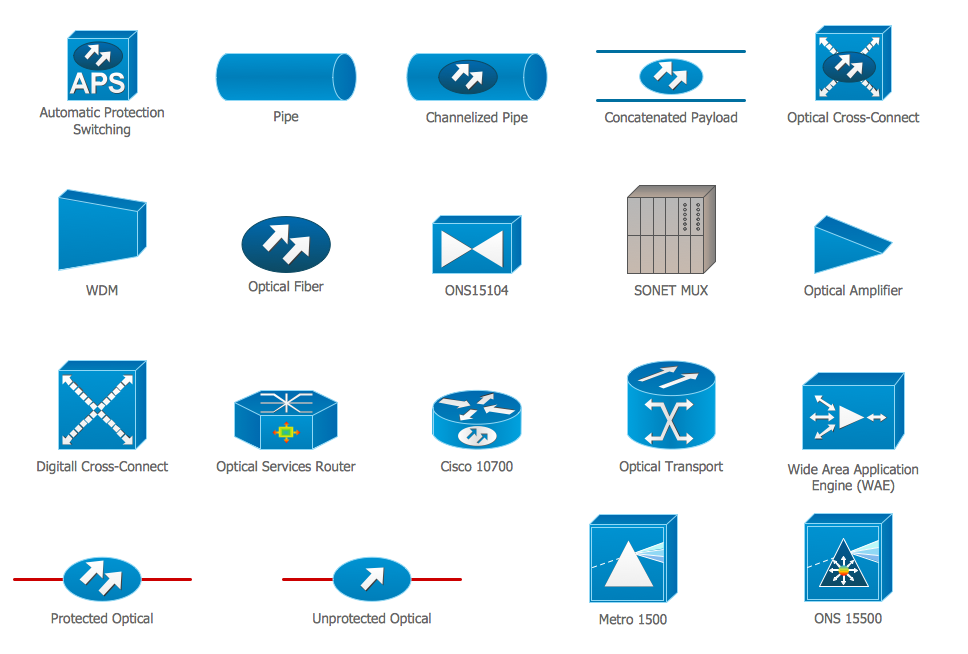
Picture: Cisco Optical. Cisco icons, shapes, stencils and symbols
Related Solution: