DES Network. Computer and Network Examples
The Data Encryption Standard (DES) is a symmetric-key algorithm for the encryption of the electronic data.
The encryption is an important issue for any organization, it allows to safely keep, handle and transmit the sensitive data through the local network, wireless network or the Internet. The encryption applies the key to the plain text and converts it into the ciphertext. The ciphertext at that looks like the set of the random characters.
The key is a mathematical algorithm known only to the sender and the recipient of the message. The applying of the key to the ciphertext will convert it back to the plain text - it is the decryption process.
This diagram was created in ConceptDraw DIAGRAM using the Computer and Networks Area of ConceptDraw Solution Park and shows how the encryption and access control work together to secure data.
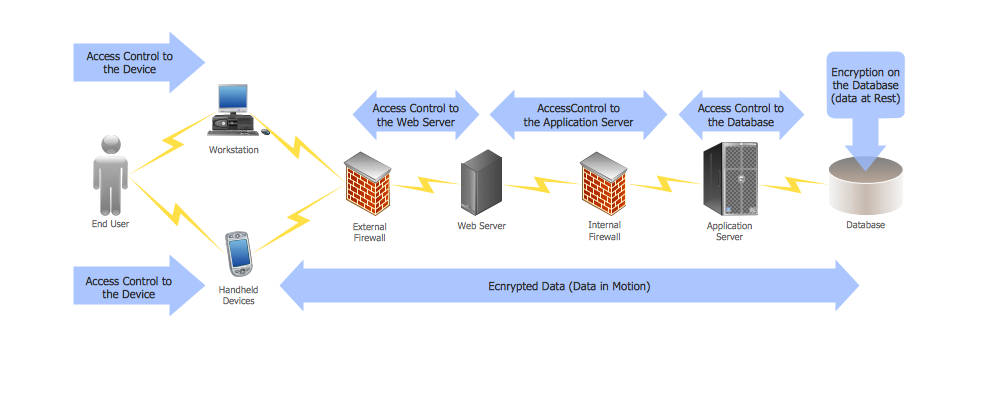
Example 1. DES network.
Using the solutions of the Computer and Networks Area for ConceptDraw DIAGRAM you can create your own computer network diagrams quick and easy.
The diagrams designed with ConceptDraw DIAGRAM are vector graphic documents and are available for reviewing, modifying, and converting to a variety of formats (image, HTML, PDF file, MS PowerPoint Presentation, Adobe Flash or MS Visio).
See also Samples:
EIGHT RELATED HOW TO's:
How to describe the necessity of using network security devices and visually illustrate this information? Now, it's very easy thanks to the ConceptDraw DIAGRAM diagramming and vector drawing software extended with Network Security Diagrams Solution from the Computer and Networks Area of ConceptDraw Solution Park.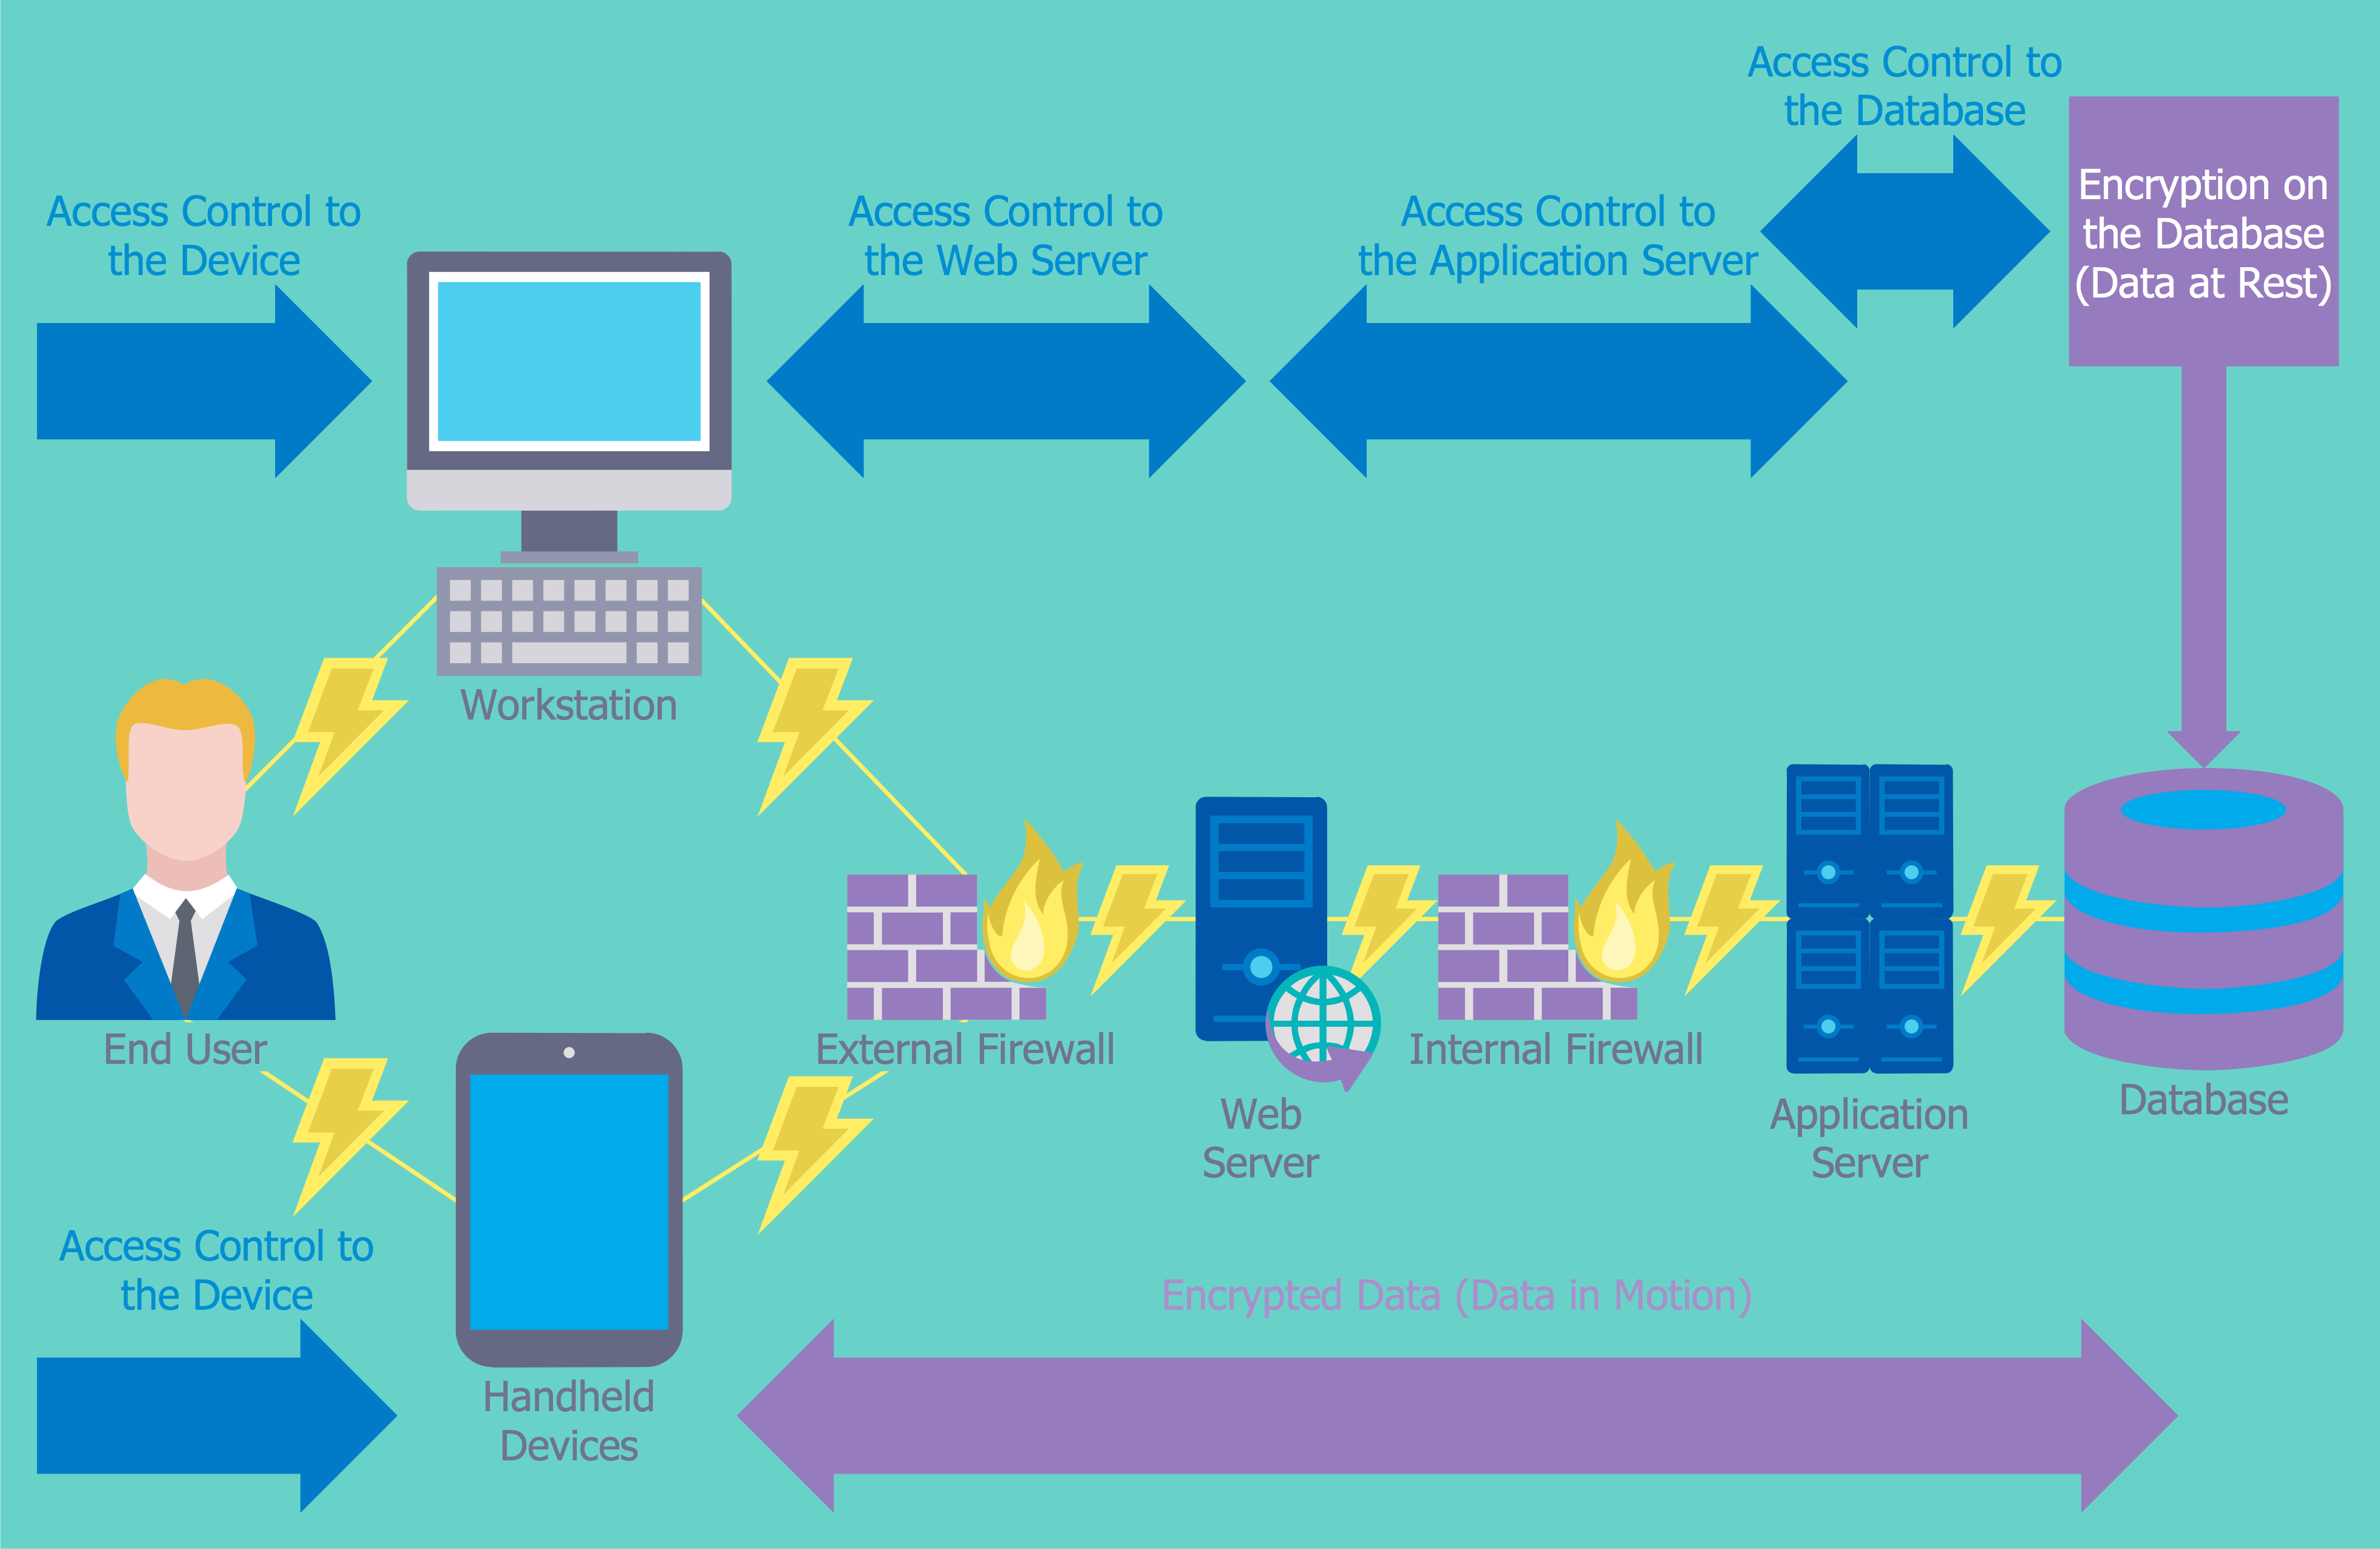
Picture: Network Security Devices
Related Solution:
Wireless Networks solution from ConceptDraw Solution Park extends ConceptDraw DIAGRAM to help network engineers and designers efficiently illustrate wireless network mode diagrams.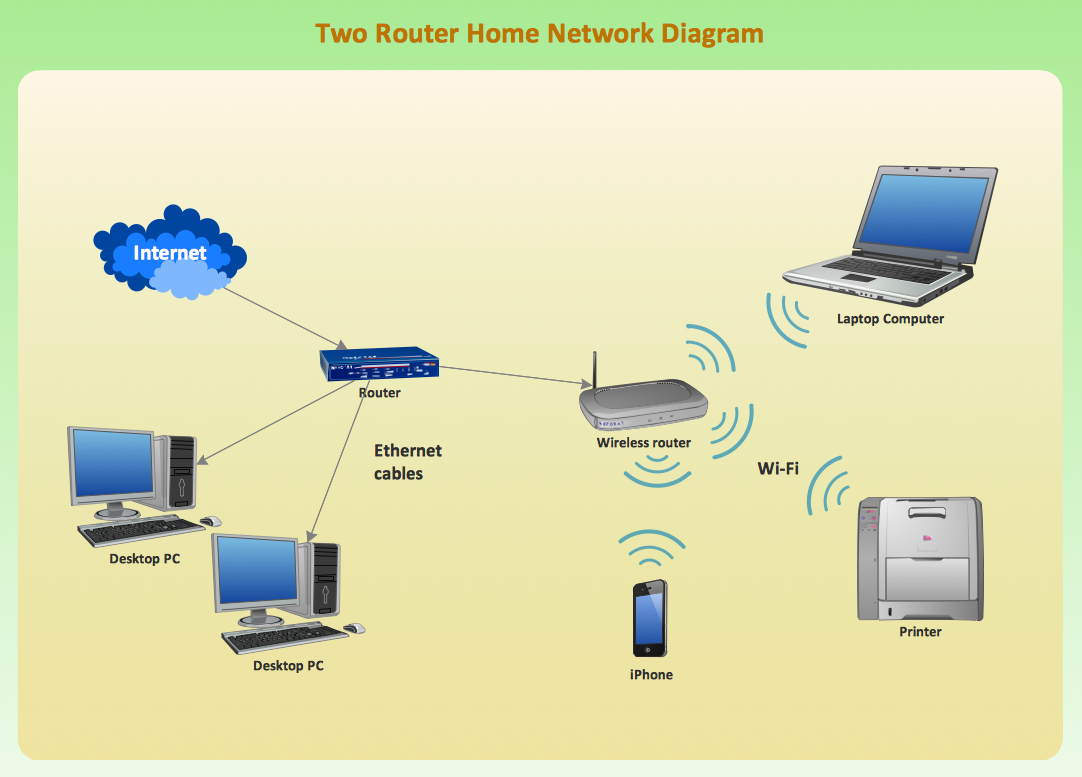
Picture: Wireless Network Mode
Related Solution:
Netflow is a network protocol used for accounting the IP network traffic. It was developed by Cisco Systems. Now it is actually the industrial standard, it is supported by many devices. There are several versions of the protocol, but the most common are the versions 5 and 9.
This diagram was created in ConceptDraw DIAGRAM using the Computer and Networks Area of ConceptDraw Solution Park and shows the Netflow architecture.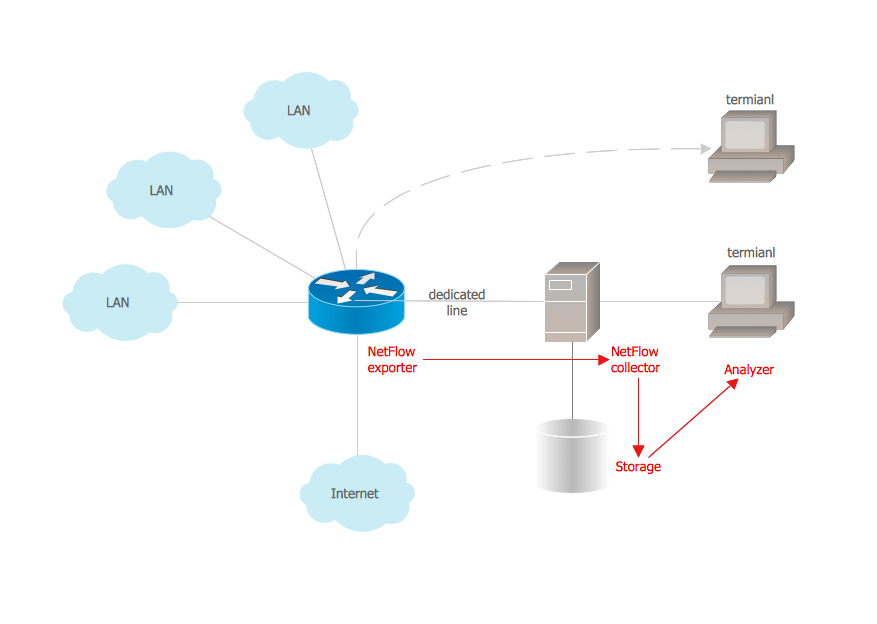
Picture: Netflow architecture. Computer and Network Examples
Related Solution:
When describing any computer network, we imagine a set of devices and nodes, arranged in some way. Talking about network structures, we should distinguish physical and logical network topologies, as physical topology is about devices location and logical topology illustrates data flow. In the same time, they do not have to match, and some devices, such as repeaters, may have a physical star layout, but a bus logical topology.
There are two main types of computer network topologies: Physical topology that show the physical organization of a network - equipment and types of connections. Star network topology involves a set of devices that is connected to a single hub (router). Ring network topology means that, devices connected according this topology have two connections, connecting with nearby devices to make a loop. Bus network topology is the topology presented at the current diagram. It is similar to a ring topology. The difference is that data moves up and down a linear connection, copying itself where network equipment works as bus-stations along the way. This network topology can be used for small network, or when adding an extra device into a network.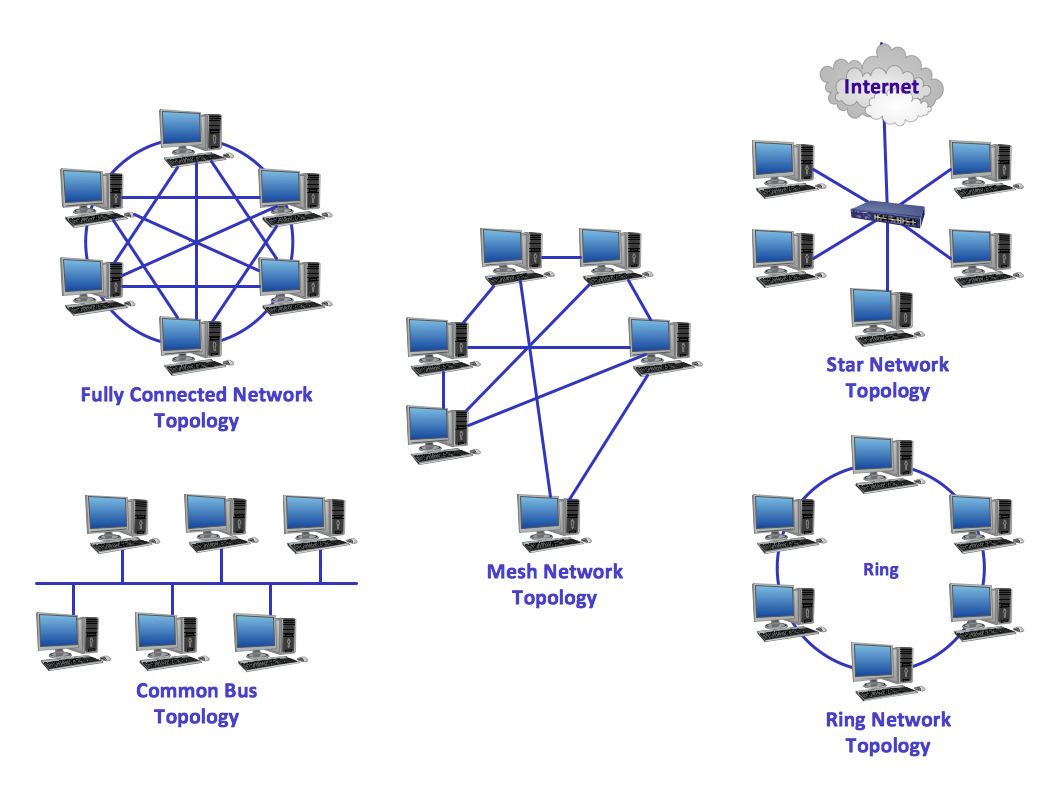
Picture: Network Topologies
Related Solution:
Learn about Virtual Private Networks (VPNs), and how they work, exploring VPN Networks with diagrams. ✔️ How to create VPN flowcharts using the ConceptDraw DIAGRAM software?
Picture:
What is a Virtual Private Network?
VPN Diagram Examples
Related Solution:
Dynamic of development computer and network technologies increases the need in modern cyber security strategies and IT security solutions to support security of your data, to ensure data privacy, and to protect your operations from the cyber threats. Thanks to the Network Security Diagrams Solution from the Computer and Networks Area of ConceptDraw Solution Park, the ConceptDraw DIAGRAM diagramming and vector drawing software is one of the unique IT security solutions for professional designing Network Security Diagrams.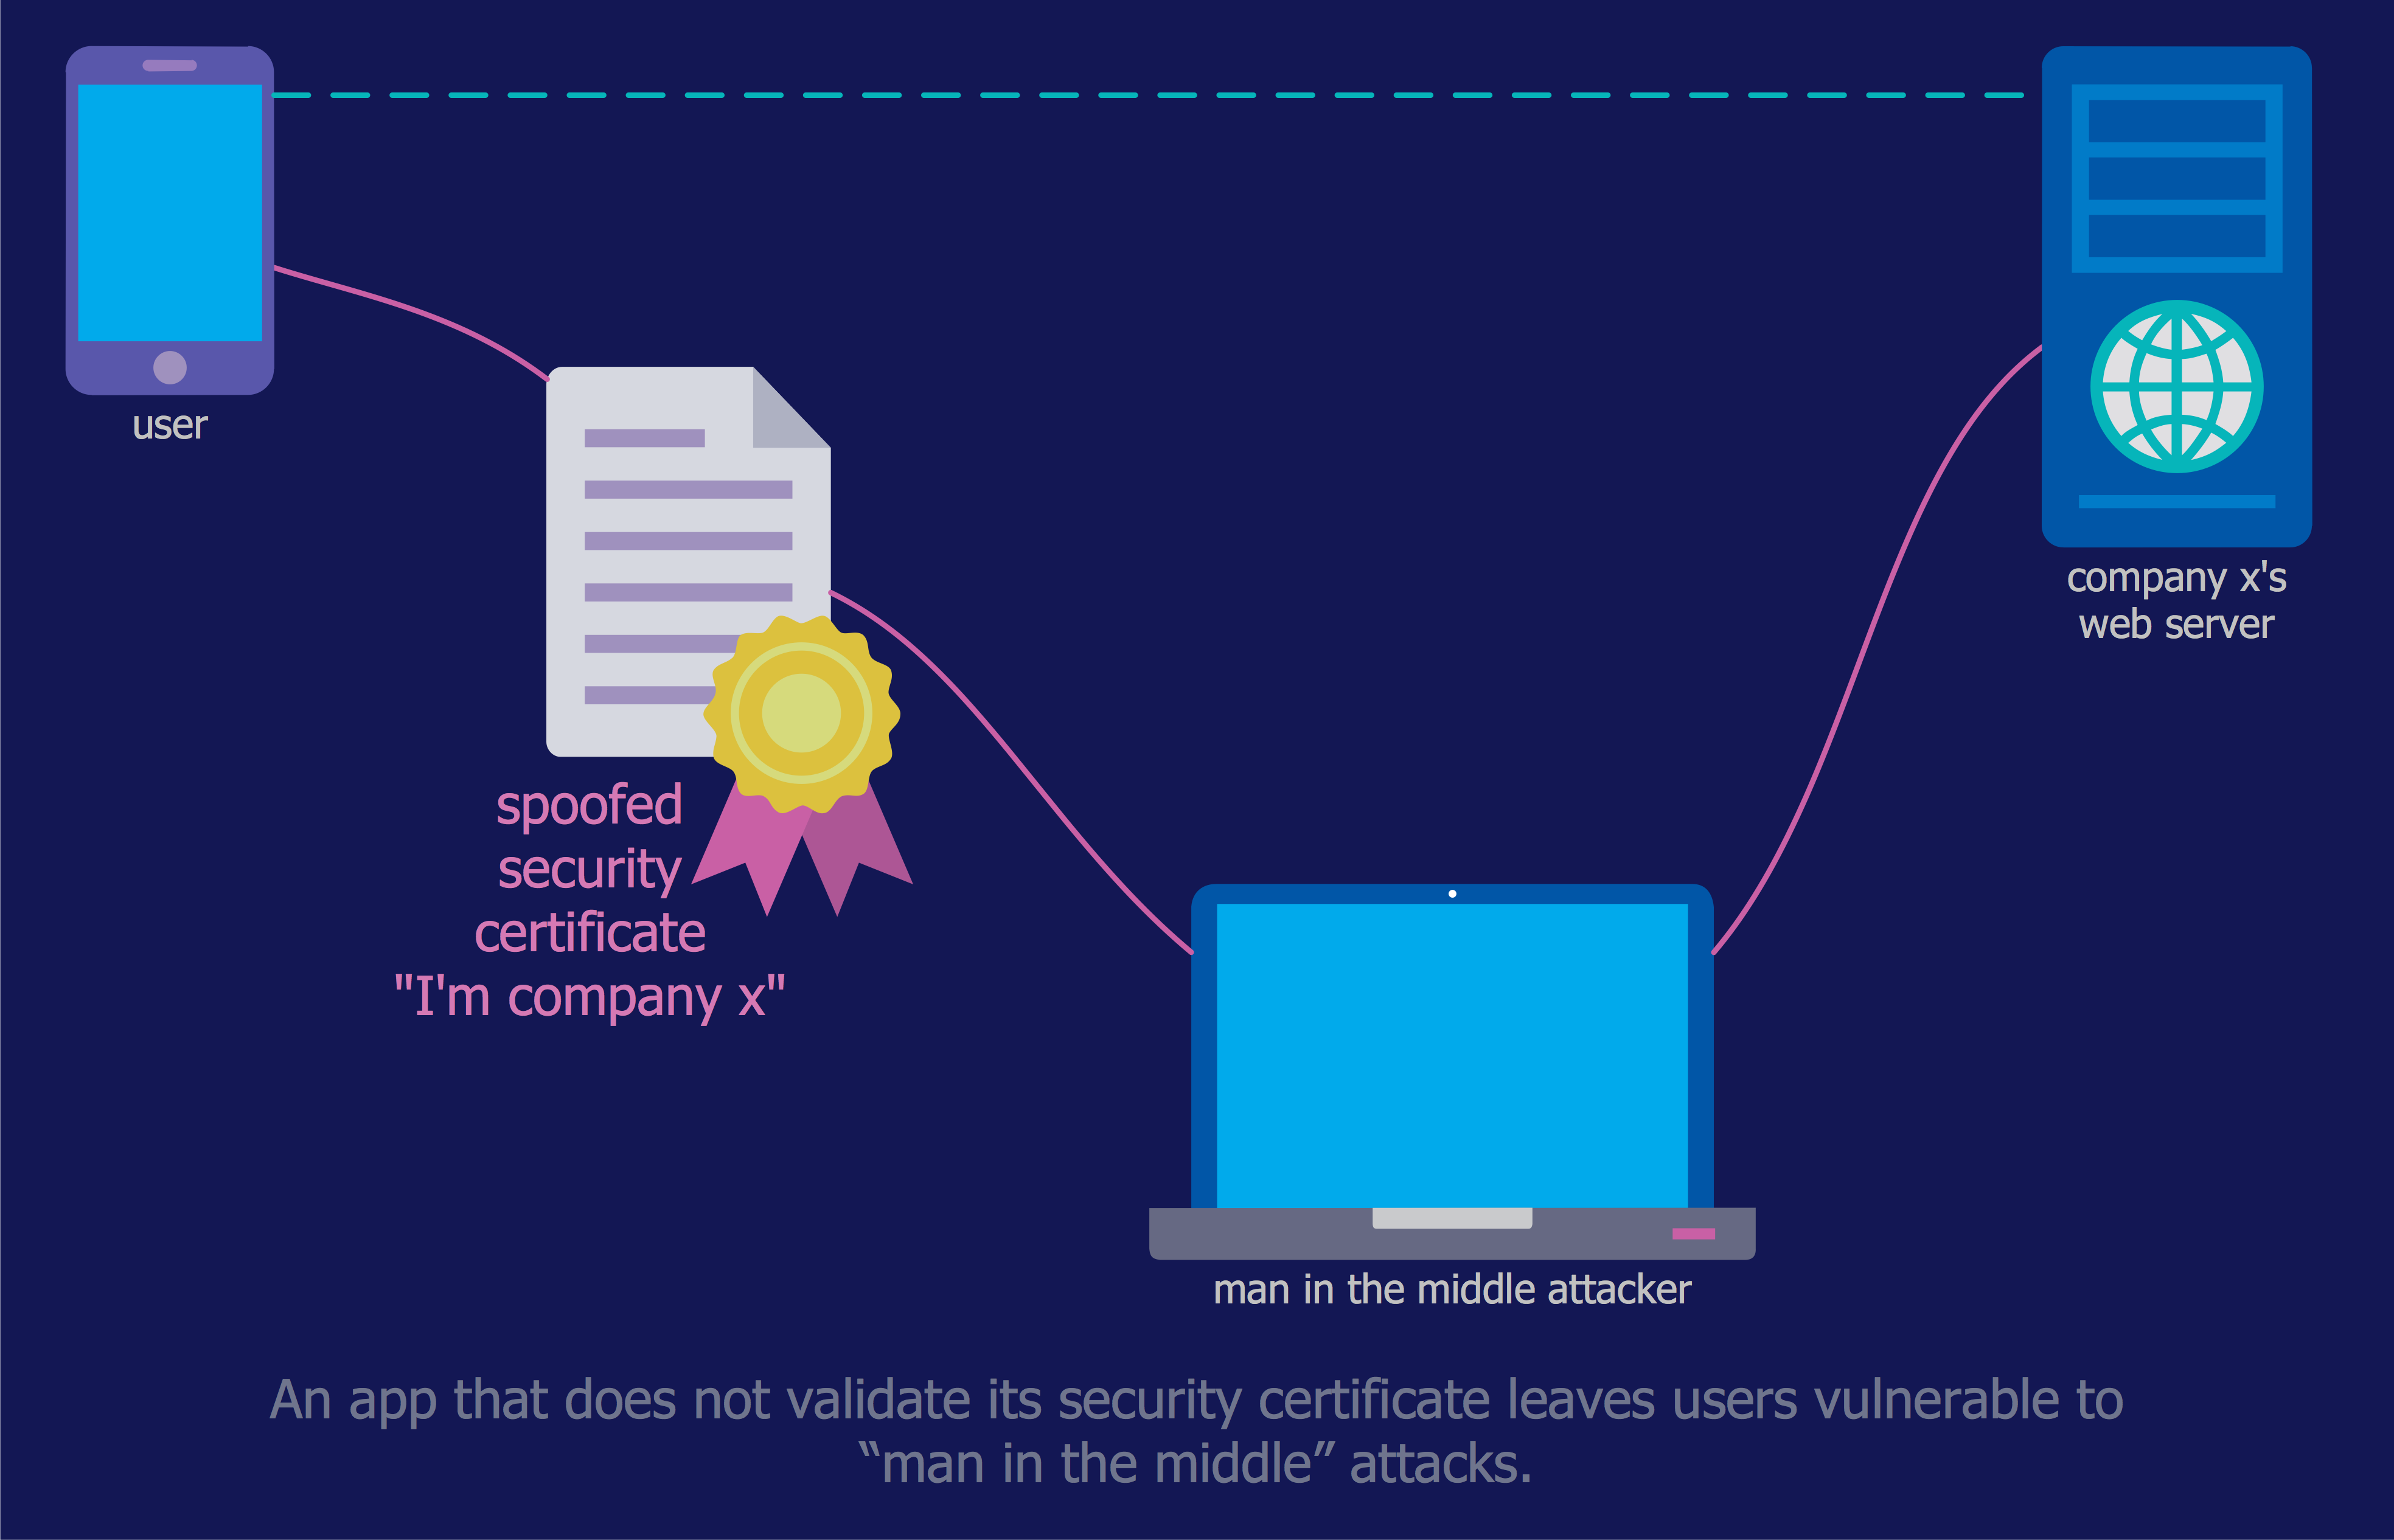
Picture: IT Security Solutions
Related Solution:
Making the Active Directory Diagrams is always better with the Active Directory Diagrams solution, developed by the specialists of CS Odessa for simplifying all the ConceptDraw DIAGRAM users’ work by making it much simpler to create the needed drawing.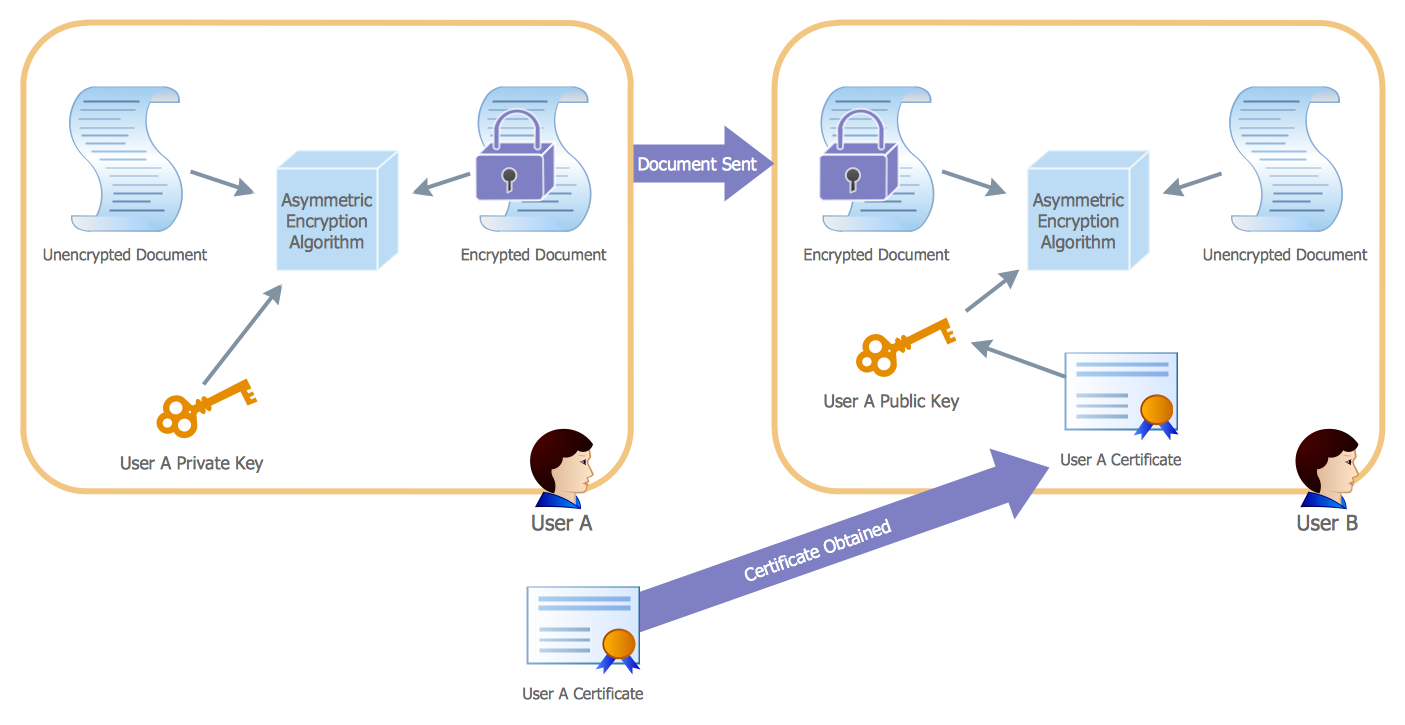
Picture: Active Directory
Related Solution:
Diagramming is an astonishing way to visualize business processes. The list of the most common business process flowchart symbols is quite long starting from basic flowcharts, continuing with SIPOC diagrams. Business process modeling was never easier than now, with special ConceptDraw Business Process Mapping solution.
To carry out all professional standard requirements for business processes mapping, it is necessarily to follow the special graphical notations. ConceptDraw Business Process Mapping solution offers an exhaustive suite of tools to aid business process mapping. There are three vector libraries SIPOC Diagrams, Business Process Flowcharts, and Swim Lanes that contains totally more than 50 symbols of standard BPM notations. This is all that professionals need to effectively evaluate and manage quality in business processes.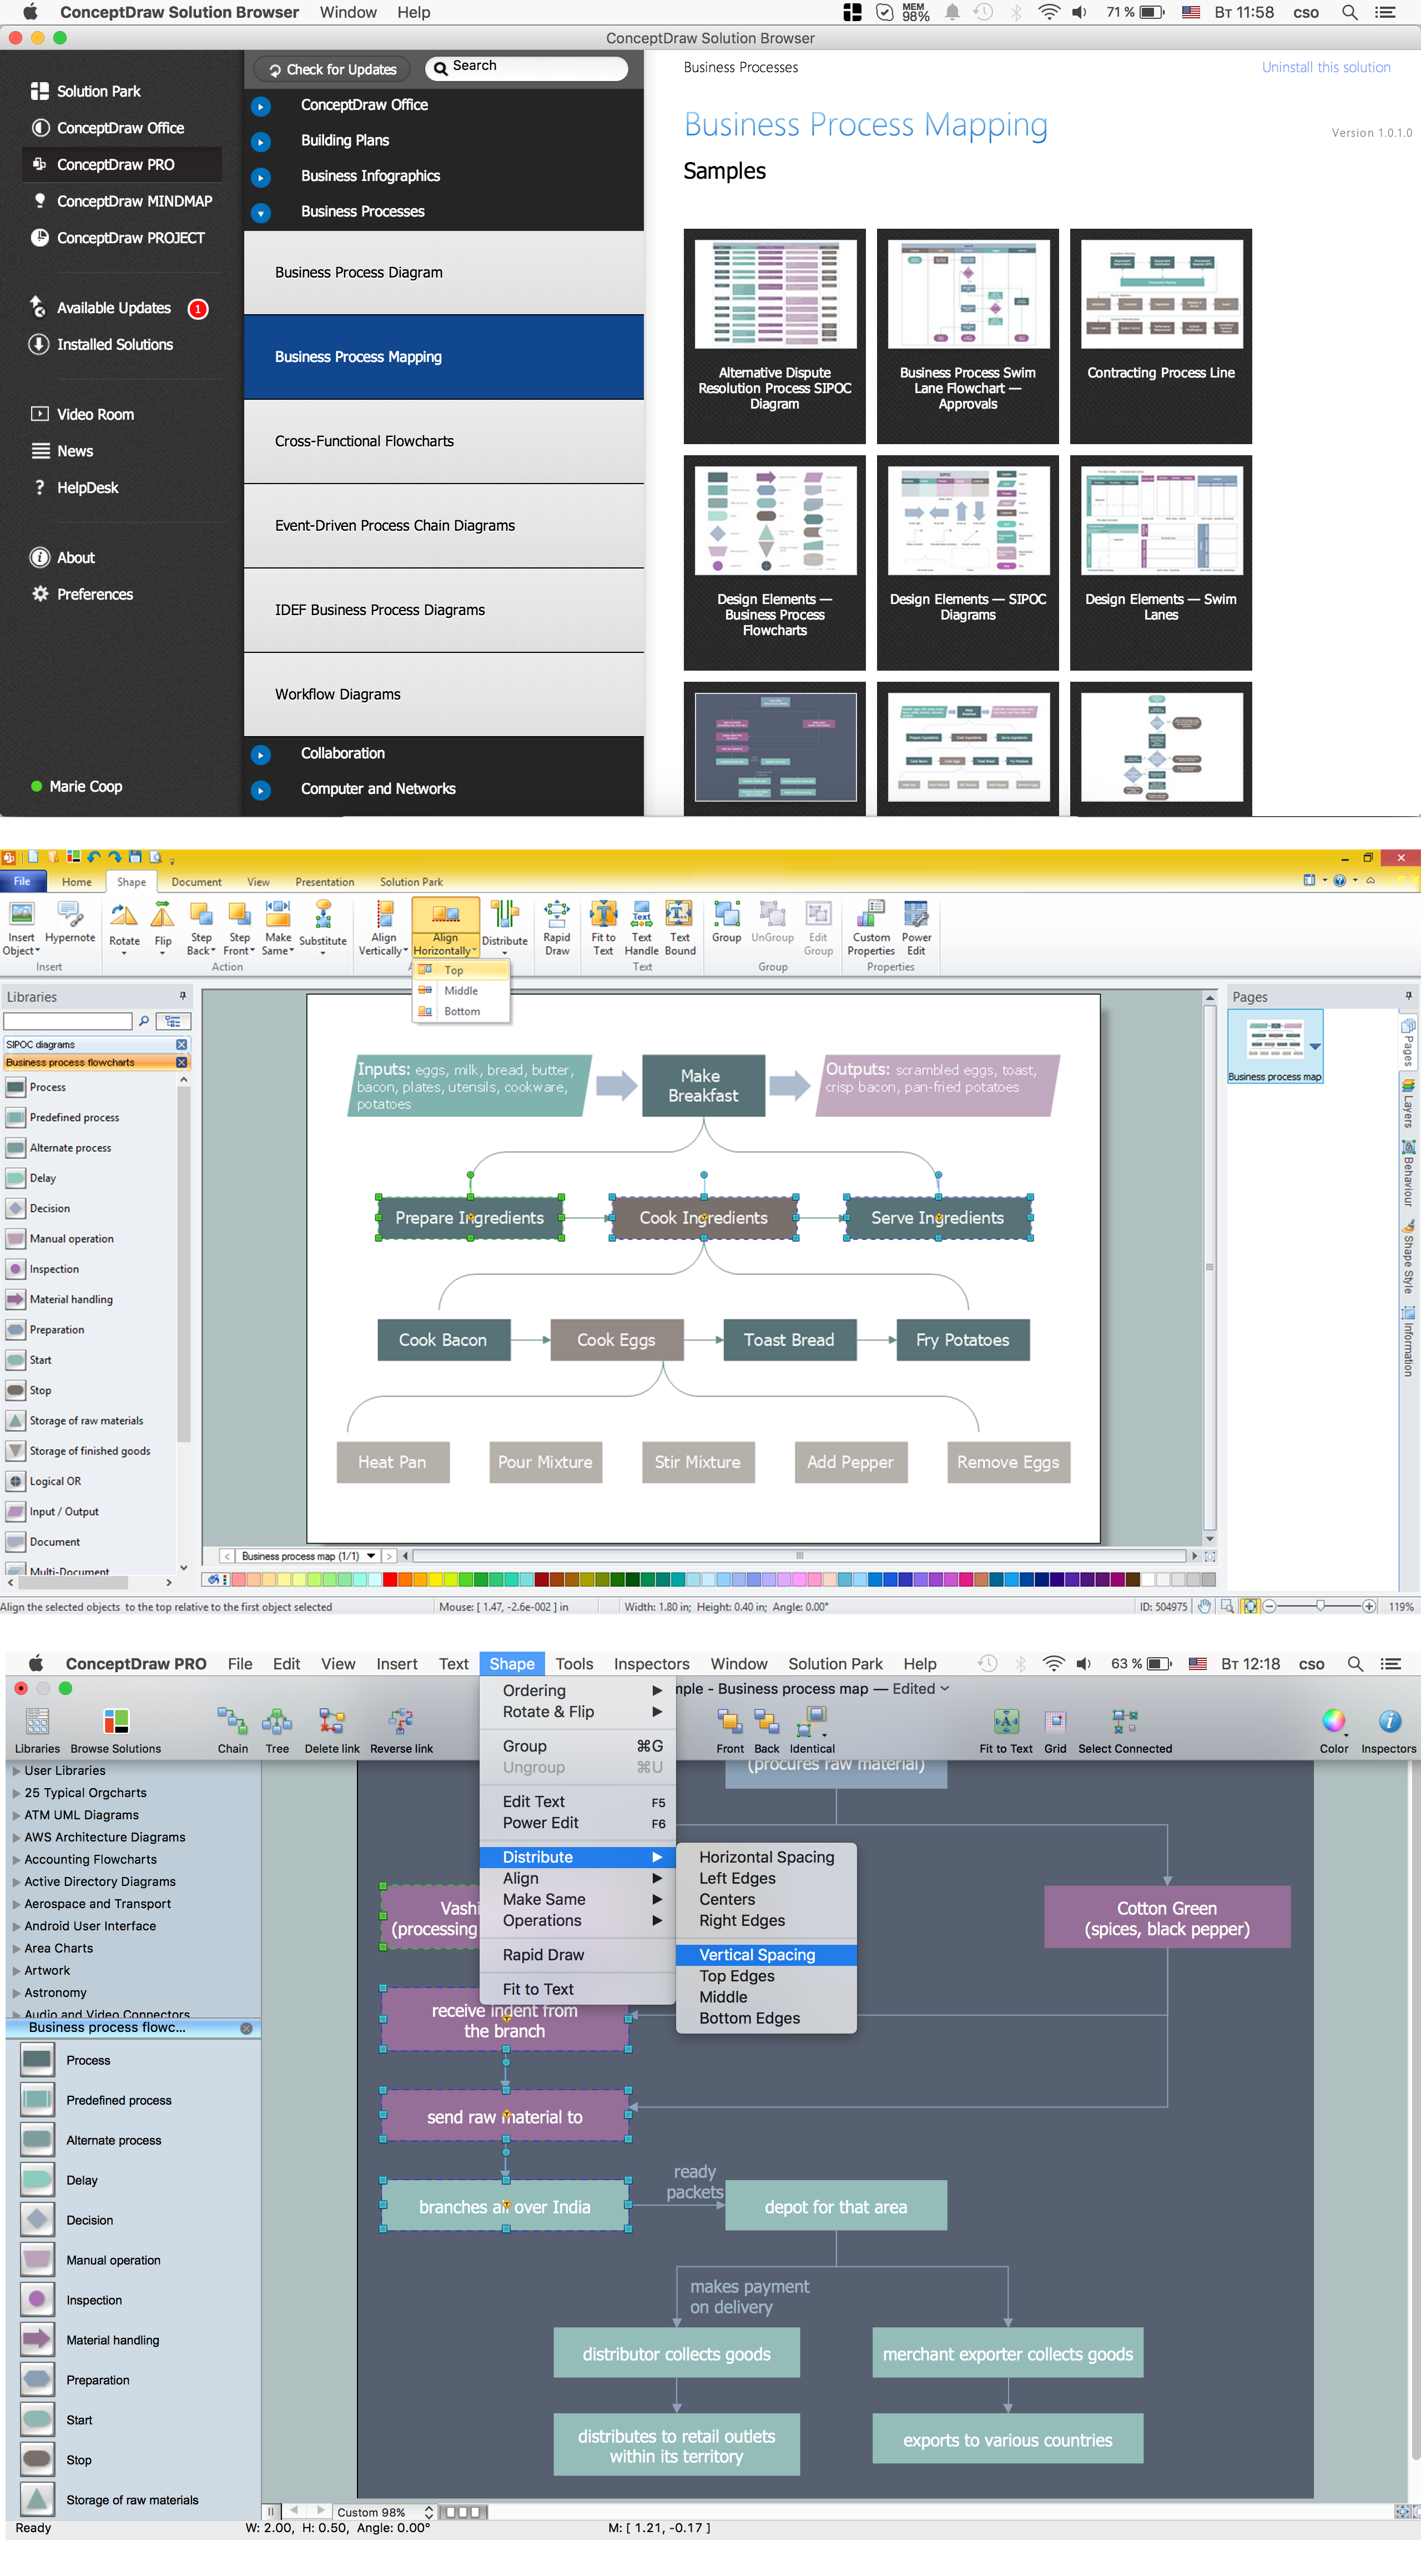
Picture: Business Process Flowchart Symbols
Related Solution: