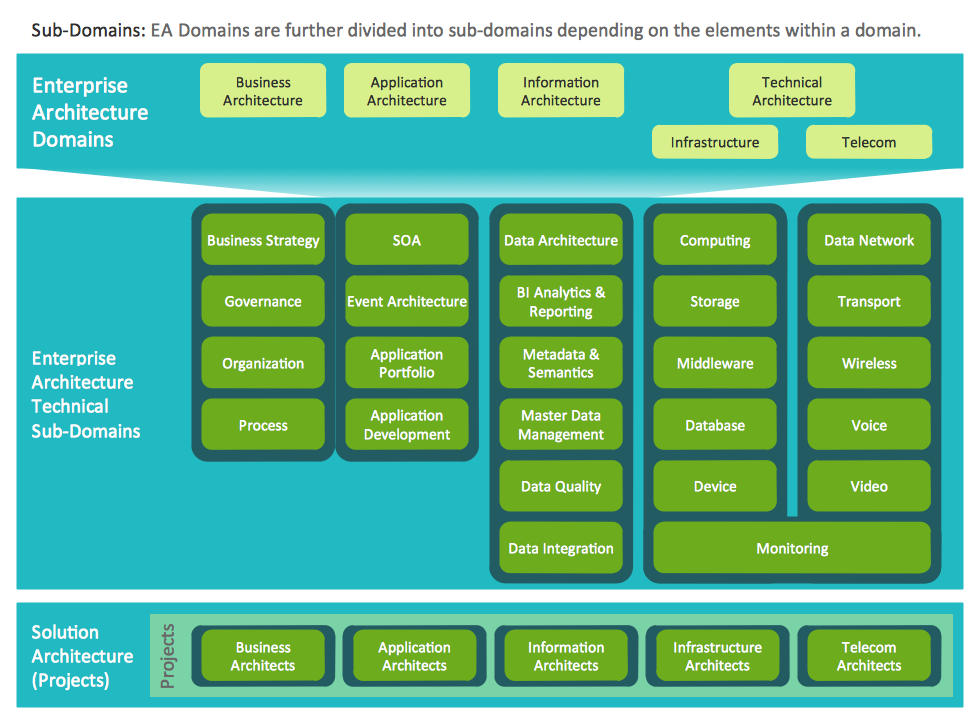
Example 1. Information Technology Architecture
Now you don't need to be an artist to create professional looking and attractive diagrams representing Information Technology Architecture. Enterprise Architecture Diagrams Solution offers you wide variety of predesigned templates and samples.

Example 2. Enterprise Architecture Diagrams Solution in ConceptDraw STORE
All templates and samples are available from ConceptDraw STORE and can be used as is or changed for your needs using the predesigned objects from the Enterprise Architecture Diagrams library that is also included in the Enterprise Architecture Diagrams Solution.

Example 3. NIH IT Enterprise Architecture Framework
The samples of Information Technology Architecture you see on this page were created in ConceptDraw DIAGRAM software using the predesigned shapes from the Enterprise Architecture Diagrams library included in Enterprise Architecture Diagrams Solution. An experienced user spent 20 minutes creating each of these samples.
Use the tools of Enterprise Architecture Diagrams Solution for ConceptDraw DIAGRAM software to effectively represent the Information Technology Architecture.
All source documents are vector graphic documents. They are available for reviewing, modifying, or converting to a variety of formats (PDF file, MS PowerPoint, MS Visio, and many other graphic formats) from the ConceptDraw STORE. The Enterprise Architecture Diagrams Solution is available for all ConceptDraw DIAGRAM or later users.
TEN RELATED HOW TO's:
A list of parameters on which networks differ is very long. A large network with a range up to 50 kilometers is called metropolitan area network (MAN), and this type of network can include several local area networks. Metropolitan networks in their turn connect into global area networks.
Here you will see a Metropolitan Area Network (MAN). This is an extensive network which occupies a large territory including a few buildings or even the whole city. The space of the MAN is bigger than LAN, but lower than WAN. MAN comprise a lot of communication equipment and delivers the Internet connection to the LANs in the city area. Computer and Networks solution for ConceptDraw DIAGRAM provides a set of libraries with ready-to-use vector objects to design various kinds of computer networks.
Picture: Metropolitan area networks (MAN). Computer and Network Examples
Related Solution:
Azure is a cloud computing platform developed by Microsoft which offers the extensive infrastructure and wide set of integrated Azure services useful for effective computing, storage, analytics, databases, networking, application development and deployment.
ConceptDraw DIAGRAM extended with Azure Architecture Solution from the Computer and Networks area is a powerful diagramming and vector drawing software with extensive set of useful drawing tools for easy creating Azure Architecture Diagrams and documenting Azure services.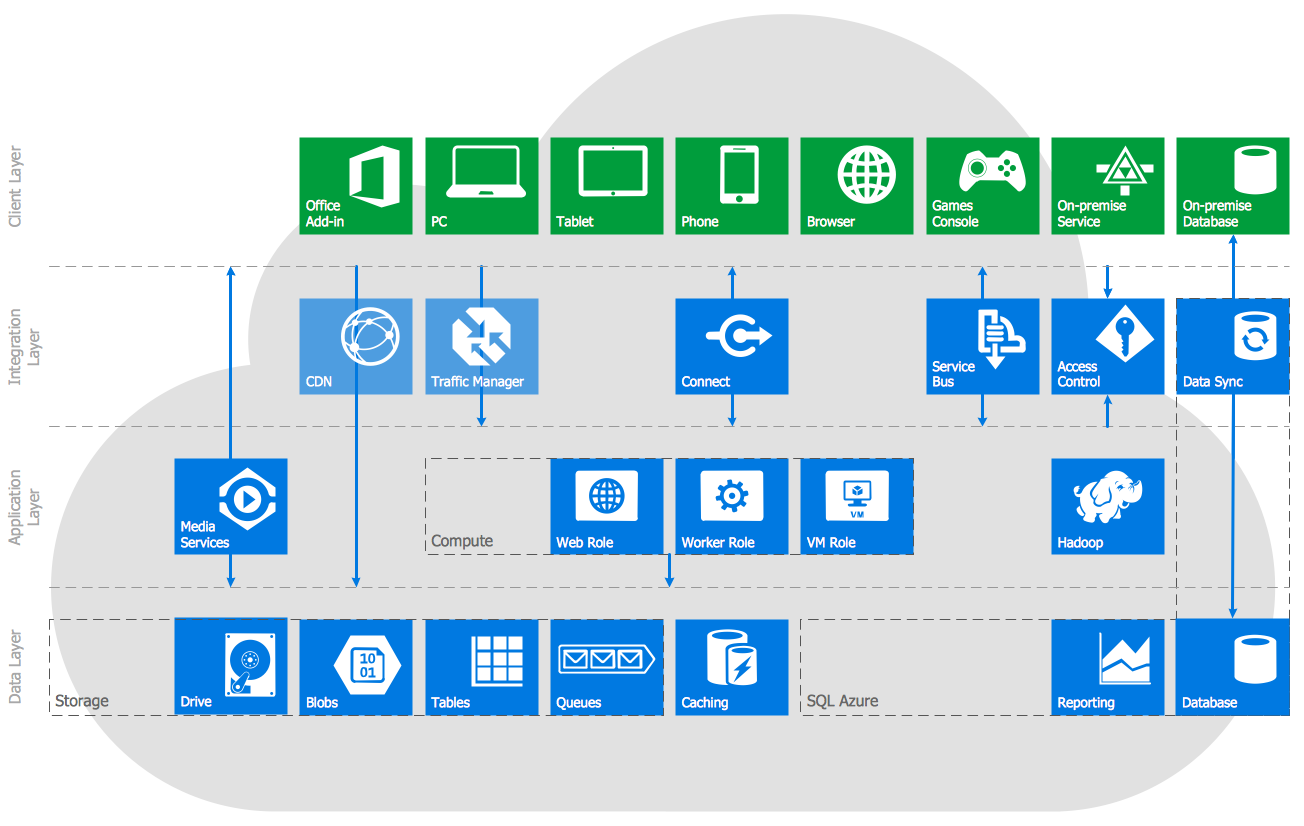
Picture: Azure Services
Related Solution:
ConceptDraw is rapid and powerful network diagram drawing software with rich examples, templates, design objects and stencils.
Picture: Draw Network Diagram based on Templates and Examples
ConceptDraw solution Computer and Networks provides Interactive Voice Response samples, templates and library of 35 vector stencils for drawing the IVR network diagrams.
Use ConceptDraw DIAGRAM diagramming and vector drawing software enhanced with solution Computer and Networks to visualize the logical and physical structure of IVR systems for inbound and outbound call centers and voice mail systems.
Picture: Interactive Voice Response Network Diagram
Planning a computer network can be a challenge for a junior specialist. However, knowing how to draw a computer network diagrams isn’t a rocket science anymore. There are a lot of special software for creating such diagrams with predesigned templates and examples.
The core for Network Fault Tolerance System presented here, is the equipment of Cisco. You can see here the certified Cisco equipment icons. Generally, ConceptDraw DIAGRAM libraries contain more than half of a thousand objects representing the standardized images of Cisco equipment. ConceptDraw solution for network diagramming is a great network diagramming tool for any level skills - from students to network guru.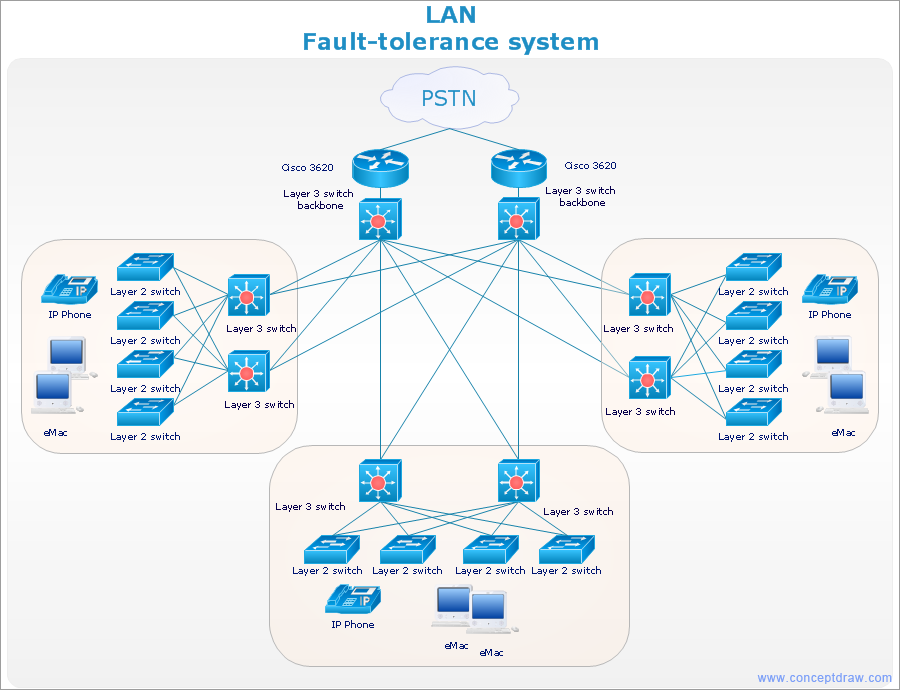
Picture: How to Draw a Computer Network Diagrams
Related Solution:
ConceptDraw - Perfect Network Diagramming Software with examples of Backbone Network Diagrams. ConceptDraw Network Diagram is ideal for network engineers and network designers who need to draw Backbone Network diagrams.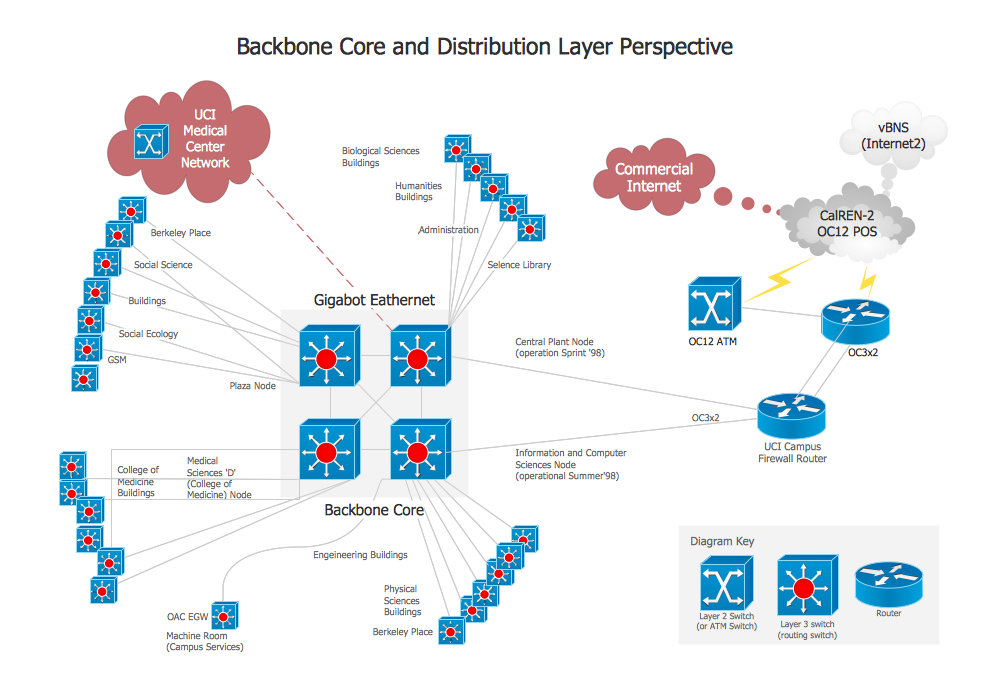
Picture: Network Diagram SoftwareBackbone Network
There are numerous articles about the advantages of flowcharting, creating business graphics and developing different charts. Nevertheless, these articles are almost useless without the main component - the examples of flowcharts, org charts and without a fine example, it is difficult to get all the conveniences of creating diagrams. You can find tons of templates and vivid examples on Solution Park.
This illustration shows a variety of business diagrams that can be created using ConceptDraw DIAGRAM. It comprises a different fields of business activities: management, marketing, networking, software and database development along with design of infographics and business illustrations. ConceptDraw DIAGRAM provides a huge set of sample drawings including business process modeling diagrams,, network diagrams, UML diagrams, orgcharts, DFD, flowcharts, ERD, geographical maps and more.
Picture: Examples of Flowcharts, Org Charts and More
Related Solution:
You want design the Information Architecture and need a powerful software for this? ConceptDraw DIAGRAM extended with Enterprise Architecture Diagrams Solution from the Management Area is exactly what you need.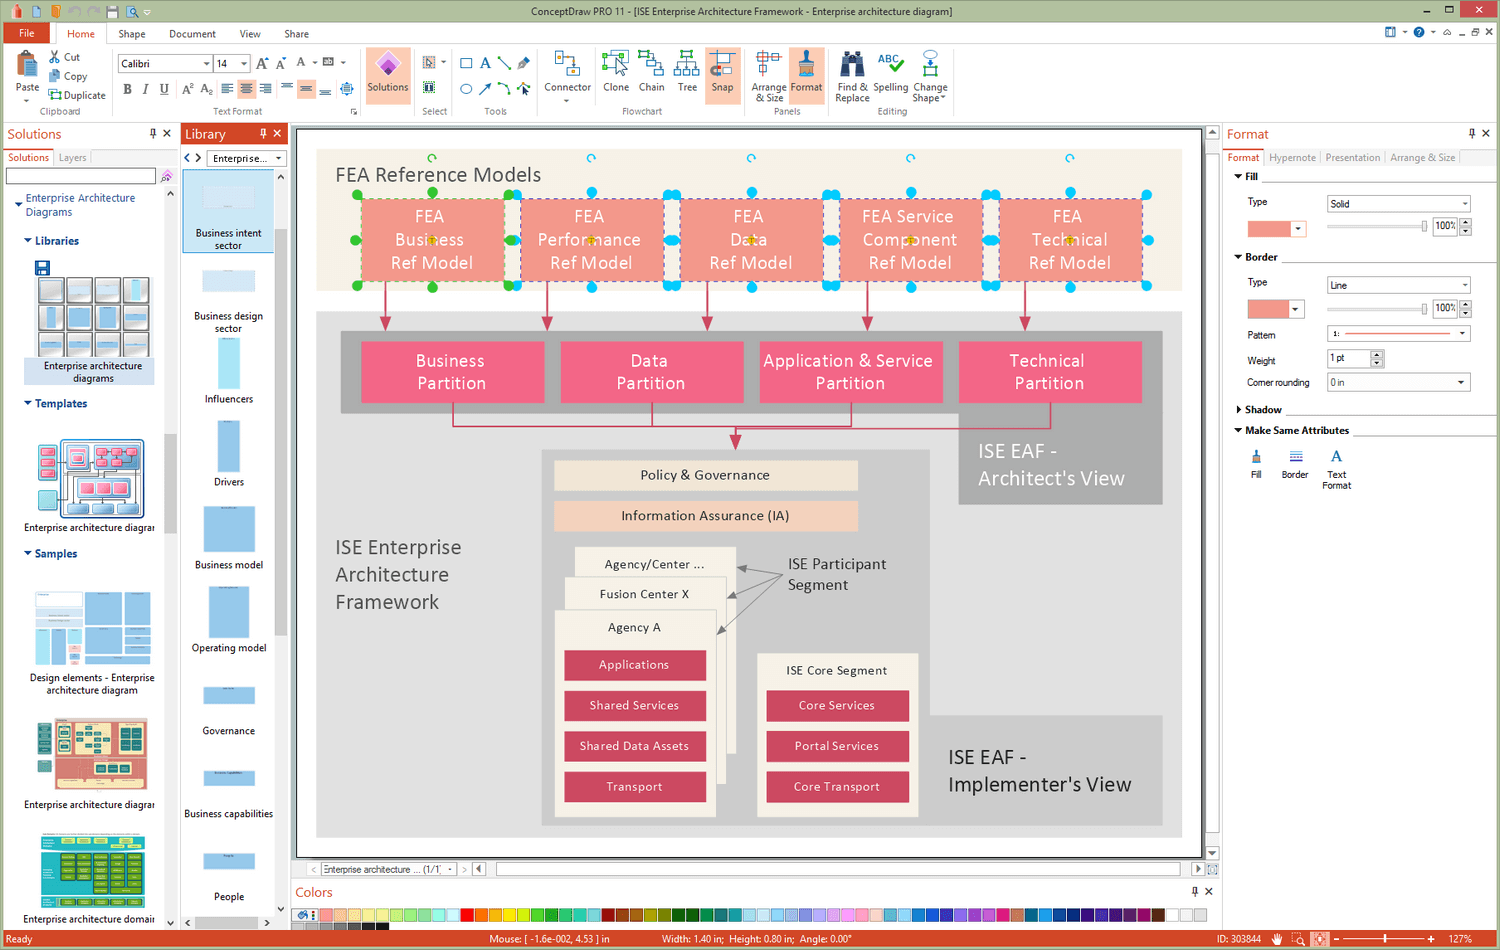
Picture: Information Architecture
Related Solution:
The Architecture Diagrams are the type of diagrams which help to system designers, system developers, and application developers to visualize the overall high-level structure of the system or application and depict the interactions between software systems, users, external systems, data sources, and services. The ConceptDraw DIAGRAM Architecture Diagrams Software provides the unique Cloud Computing Diagrams solution from the Computers and Network area of ConceptDraw Solution Park with wide set of powerful tools for fast and easy creating various types of Architecture diagrams.
Picture: Architecture Diagrams
Related Solution:
This sample was created in ConceptDraw DIAGRAM diagramming and vector drawing software using the Flowcharts solution from the Diagrams area of ConceptDraw Solution Park.
This sample shows the Flowchart that displays the procedures of 2PP (two-party preferred) voting and counting the voters. The two-party-preferred vote is the result of the elections that was distributed to the final two parties.
Picture: Basic Flowchart Images. Flowchart Examples
Related Solution:

