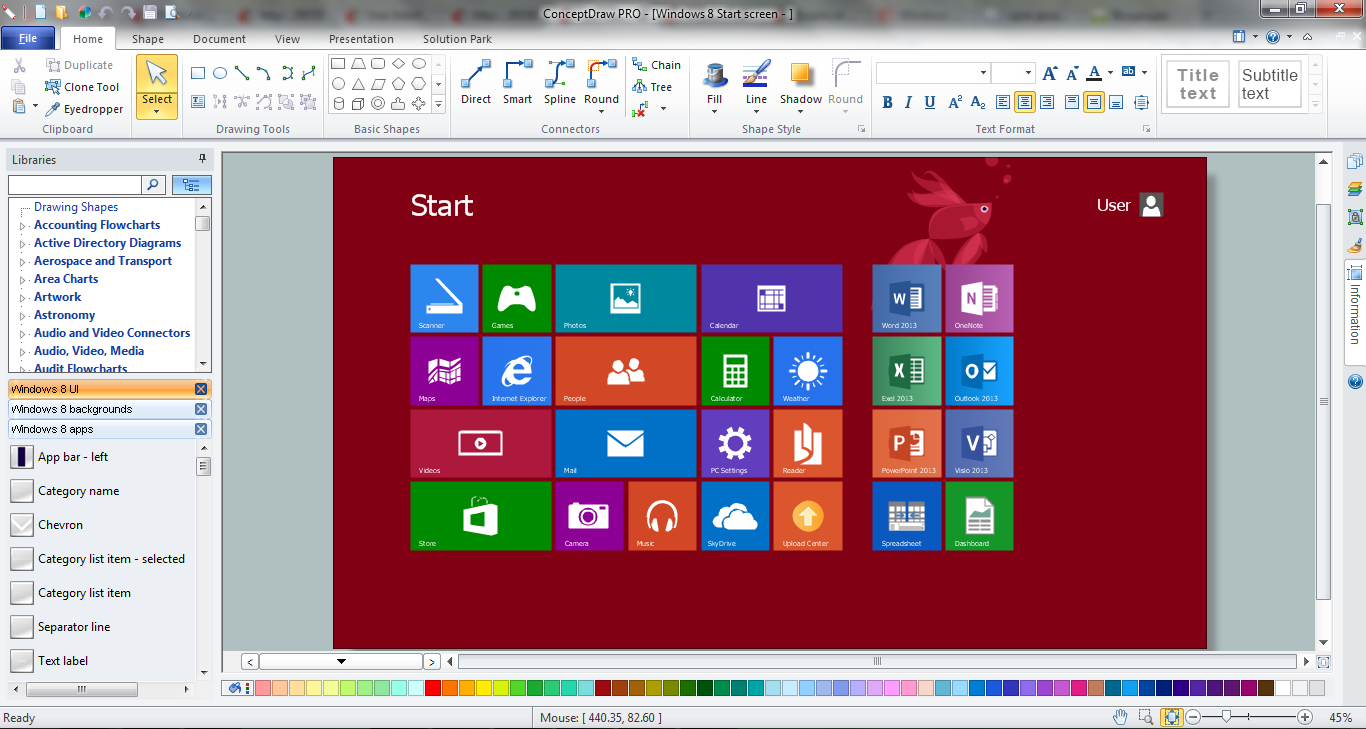
Example 1. ConceptDraw DIAGRAM GUI Software
ConceptDraw DIAGRAM as GUI software proposes you a few variants of quick and easy designing graphical user interfaces for Windows 8. First of them is to use the vector objects from the numerous libraries of Windows 8 User Interface Solution. These 14 libraries contain an incredibly large number of objects for any possible GUI interface. Let's verify this!
The easiest way of Windows 8 GUI interfaces designing is to use the predesigned graphical user interface examples, templates and samples that you can open from ConceptDraw STORE.

Example 2. Windows 8 User Interface Solution in ConceptDraw STORE
All examples offered in ConceptDraw STORE are available for change according to your needs.

Example 3. Windows 8 User Interface Solution - PC Settings
The following features make ConceptDraw DIAGRAM the best GUI software:
- You don't need to be an artist to draw professional looking GUI interfaces in a few minutes.
- Large quantity of ready-to-use vector objects makes your drawing GUI interfaces quick and easy.
- Great number of predesigned templates and samples give you the good start for your own GUI interfaces.
- ConceptDraw DIAGRAM provides you the possibility to use the grid, rules and guides. You can easily rotate, group, align, arrange the objects, use different fonts and colors to make your GUI interface exceptionally looking.
- All ConceptDraw DIAGRAM documents are vector graphic files and are available for reviewing, modifying, and converting to a variety of formats: image, HTML, PDF file, MS PowerPoint Presentation, Adobe Flash, MS Visio.
- Using ConceptDraw STORE you can navigate through ConceptDraw Solution Park, managing downloads and updates. You can access libraries, templates and samples directly from the ConceptDraw STORE.
- If you have any questions, our free of charge support is always ready to come to your aid.
TEN RELATED HOW TO's:
What is user interface (UI)? User interface of any information device includes everything designed you can interact - the screen you are looking, the icons you are clicking. ConceptDraw DIAGRAM extended with iPhone User Interface Solution is the best diagramming and vector drawing software for designing clear, pleasant and convenient user interfaces. Convenience is the most important moment for users.
Picture: What Is User Interface?
Related Solution:
How To Draw an iPhone? It's very fast and easy to draw an iPhone and design iPhone user interface using the tools of ConceptDraw DIAGRAM extended with iPhone User Interface Solution. iPhone User Interface Solution offers you the incredibly large quantity of predesigned objects that are grouped to 9 libraries: Apps Icons, Bars, Content Views, Controls, iMessage, iPhone 6 Mockup, Tab Bar Icons, Temporary Views, Toolbar and Navigation Bar Buttons.
Picture: How To Draw an iPhone?
Related Solution:
It's impossible to imagine our life without infographics! They are very popular in many fields of science, work and life activity. Management infographics, daily infographic are the good way for representing various information, complex knowledge in a visual comprehensive form. Try design them quick, easy and effective with new powerful Management Infographics Solution from the Business Infographics Area for ConceptDraw Solution Park.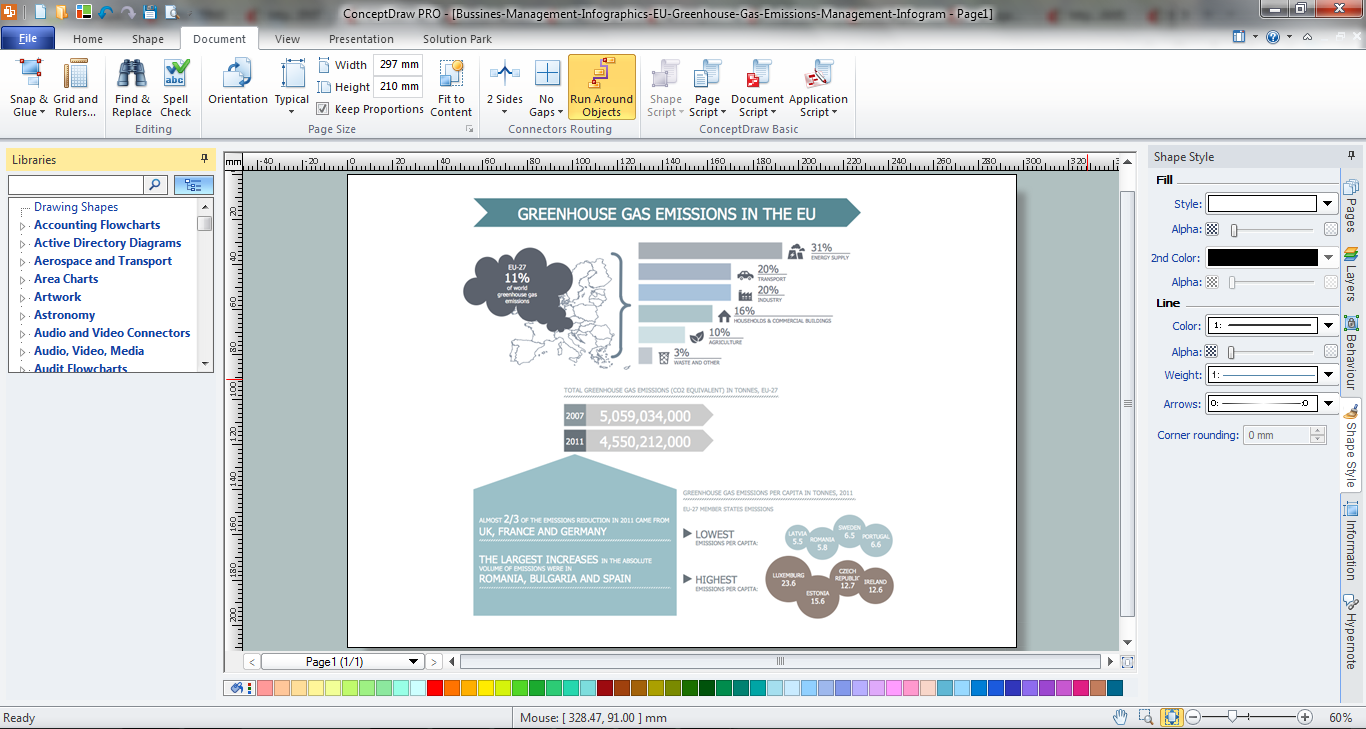
Picture: Daily Infographic
Related Solution:
Astronomy solution contains 4 libraries with vector objects of all variety of constellations: Constellations Except Zodiac Northern and Southern, Northern Constellations, Southern Constellations and Zodiac Constellations.
Picture: Constellation Chart
Related Solution:
A layout is a way that furniture is arranged in some place. It’s not difficult to develop a store layout using software with tons of templates and libraries with vector shapes of furniture, doors, walls etc. Create a plan in five minutes and have more time to implement it.
Designing the floor plan for a new store is very important step for a small business. Well thought out and well-done floor plan is the foundation of the store layout. It should provide a basis through which to make out and organize everything else. Sometimes a small stores have a small floor space, so well thought out arrangement of furniture and commercial equipment is crucial to the success of the business. By using the ConceptDraw Floor Plans solution you can make a floor plan for your store quickly and effortlessly.
Picture: Store Layout Software
Related Solution:
Many people who use mind mapping software for personal organizing find ConceptDraw MINDMAP sufficiently useful mind mapping tool in their business and daily life. Especially many positive responses receive ConceptDraw MINDMAP as cross platform tool to mind maps for Macintosh and Windows.
Picture: Think and act effectively
Website wireframes are convenient and widely used by developers, visual designers, business analysts, and many other people related with projection, development and promotion websites. Usually website wireframes look lacking of brilliance, but they effectively reflect website functionality, content and visually represent its skeletal framework.
ConceptDraw DIAGRAM software offers a unique Website Wireframe solution from the Software Development area with all needed tools for fast and easy drawing professional looking website wireframe with attractive interface design.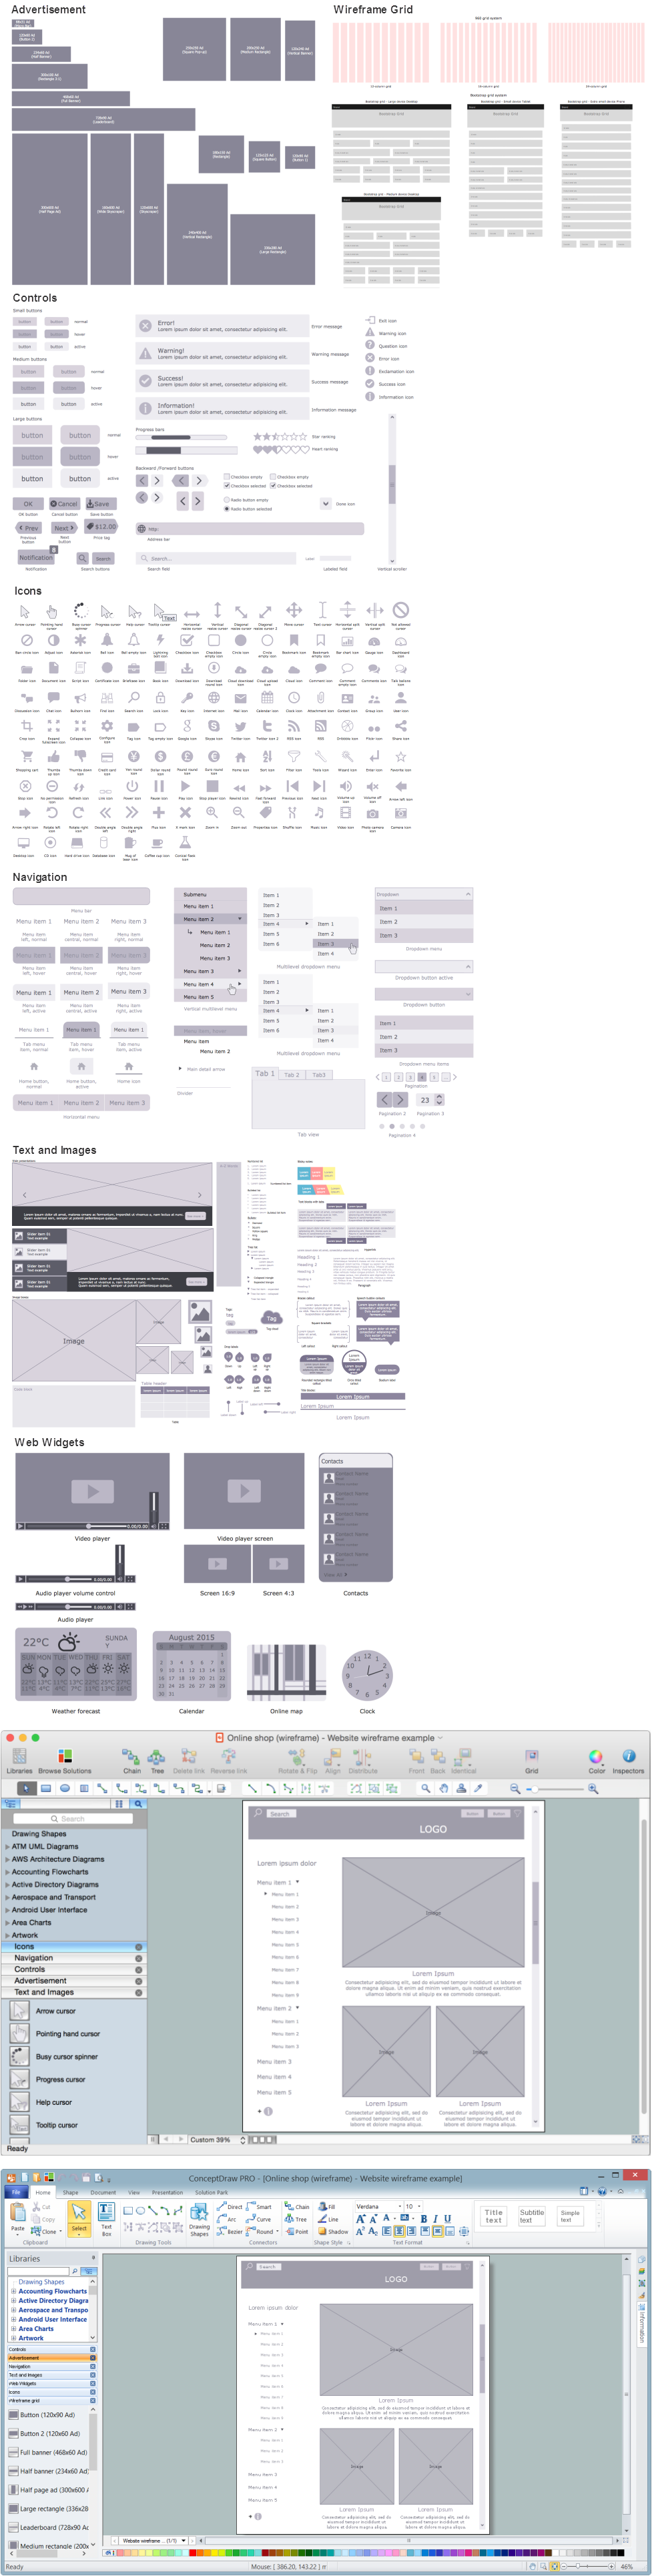
Picture: Interface Design
Related Solution:
Example of Organizational Chart - Lots of organization chart examples created by ConceptDraw Organizational Chart Software. Include company organizational chart, hospital organizational chart, hotel Organizational chart, corporate organizational chart samples etc
Picture: Example of Organizational Chart
Related Solution:
Electrical Engineering Solution used together with ConceptDraw DIAGRAM drawing facilities makes short a work of drawing various electrical and electronic circuit schemes. A library of vector objects composed from symbols of Analog and Digital Logic elements of electric circuit includes 40 symbolic images of logic gates, bistable switches of bi-stable electric current, circuit controllers, amplifiers, regulators, generators, etc. All of them can be applied in electronic circuit schemes for showing both analog and digital elements of the circuit.
Electrical Engineering Solution used together with ConceptDraw DIAGRAM drawing facilities makes short a work of drawing various electrical and electronic circuit schemes. A library of vector objects composed from symbols of Analog and Digital Logic elements of electric circuit includes 40 symbolic images of logic gates, bistable switches of bi-stable electric current, circuit controllers, amplifiers, regulators, generators, etc. All of them can be applied in electronic circuit schemes for showing both analog and digital elements of the circuit.
Picture:
Electrical Diagram Symbols F.A.Q.
How to Use Electrical ConceptDraw Diagram Software
Related Solution:
Software development flourishes nowadays. Students have tons of educational information and courses that would fit every taste. And it's no secret that knowing how to draw data flow diagrams is a useful skill for a future software architect. The diagrams help a lot in understanding how to storage data effectively and how data processes within a system.
This data flow diagram represents the model of small traditional production enterprise. It was created using Yourdon and Coad notation. The data flow diagram include four main objects: entity, process, data store and data flow. Yourdon and Coad notation uses circles to depict processes and parallel lines to represent data stores. Dataflows are shown as arrowed lines. They are labeled with the description of the data that move through them. Dataflow's role is to deliver the pieces of information. A process's function is to transform. the input data flow into output data flow. ConceptDraw Data Flow Diagrams solution contains the data flow diagram symbols of both Yourdon-Coad and Gane-Sarson notations and a set of handy templates to get started with DFD.
Picture: Data Flow Diagrams
Related Solution:


