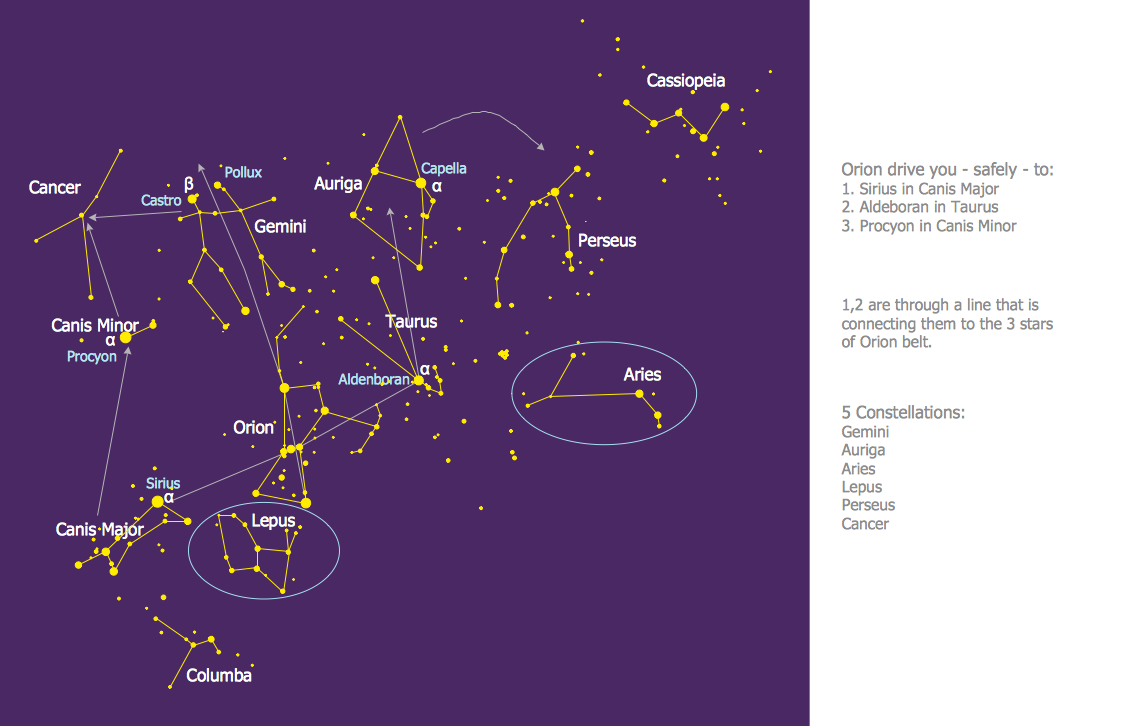
Sample 1. Constellation Chart - Orion Network
Astronomy Solution contains 4 libraries with vector objects of all variety of constellations:
- Constellations Except Zodiac Northern and Southern
- Northern Constellations
- Southern Constellations
- Zodiac Constellations

Sample 2. Astronomy Solution – Northern Constellations Design Elements
Astronomy solution also includes a set of predesigned templates and samples to help you design any constellation chart in minutes. You can find them in ConceptDraw STORE and use for your needs.

Sample 3. Constellation Chart - Summer Triangle Network
To draw the professionally looking constellation chart quick and easy, follow the next steps: create the new ConceptDraw DIAGRAM document, drag the constellation objects from the libraries of Astronomy solution, type the text and title, color the background, etc.
You can also use the predesigned template or sample and simply change it - it’s the fastest way of constellation chart designing.

Sample 4. Constellation Chart - Pegasus Network
The constellation charts you see on this page were created in ConceptDraw DIAGRAM using the Astronomy Solution for ConceptDraw DIAGRAM An experienced user spent 10 minutes creating every of these samples.
All source documents are vector graphic documents. They are available for reviewing, modifying, or converting to a variety of formats (PDF file, MS PowerPoint, MS Visio, and many other graphic formats) from the ConceptDraw STORE. The Astronomy Solution is available for all ConceptDraw DIAGRAM or later users.
TEN RELATED HOW TO's:
Nowdays business people’s figures are most favourite vector illustrations among presenters and designers. It is easy to make them and use, but they can make your graphics look really good looking & eye catching.
Just check ConceptDraw business perople figusers pictures, you will see all kinds of silhouetes: Staff, Employed workers, Persons and Groups symbols.
Best popular vector pictures are: men, dancing people, business man.
Use human contours wise and it will help you to tell main idea of your design message.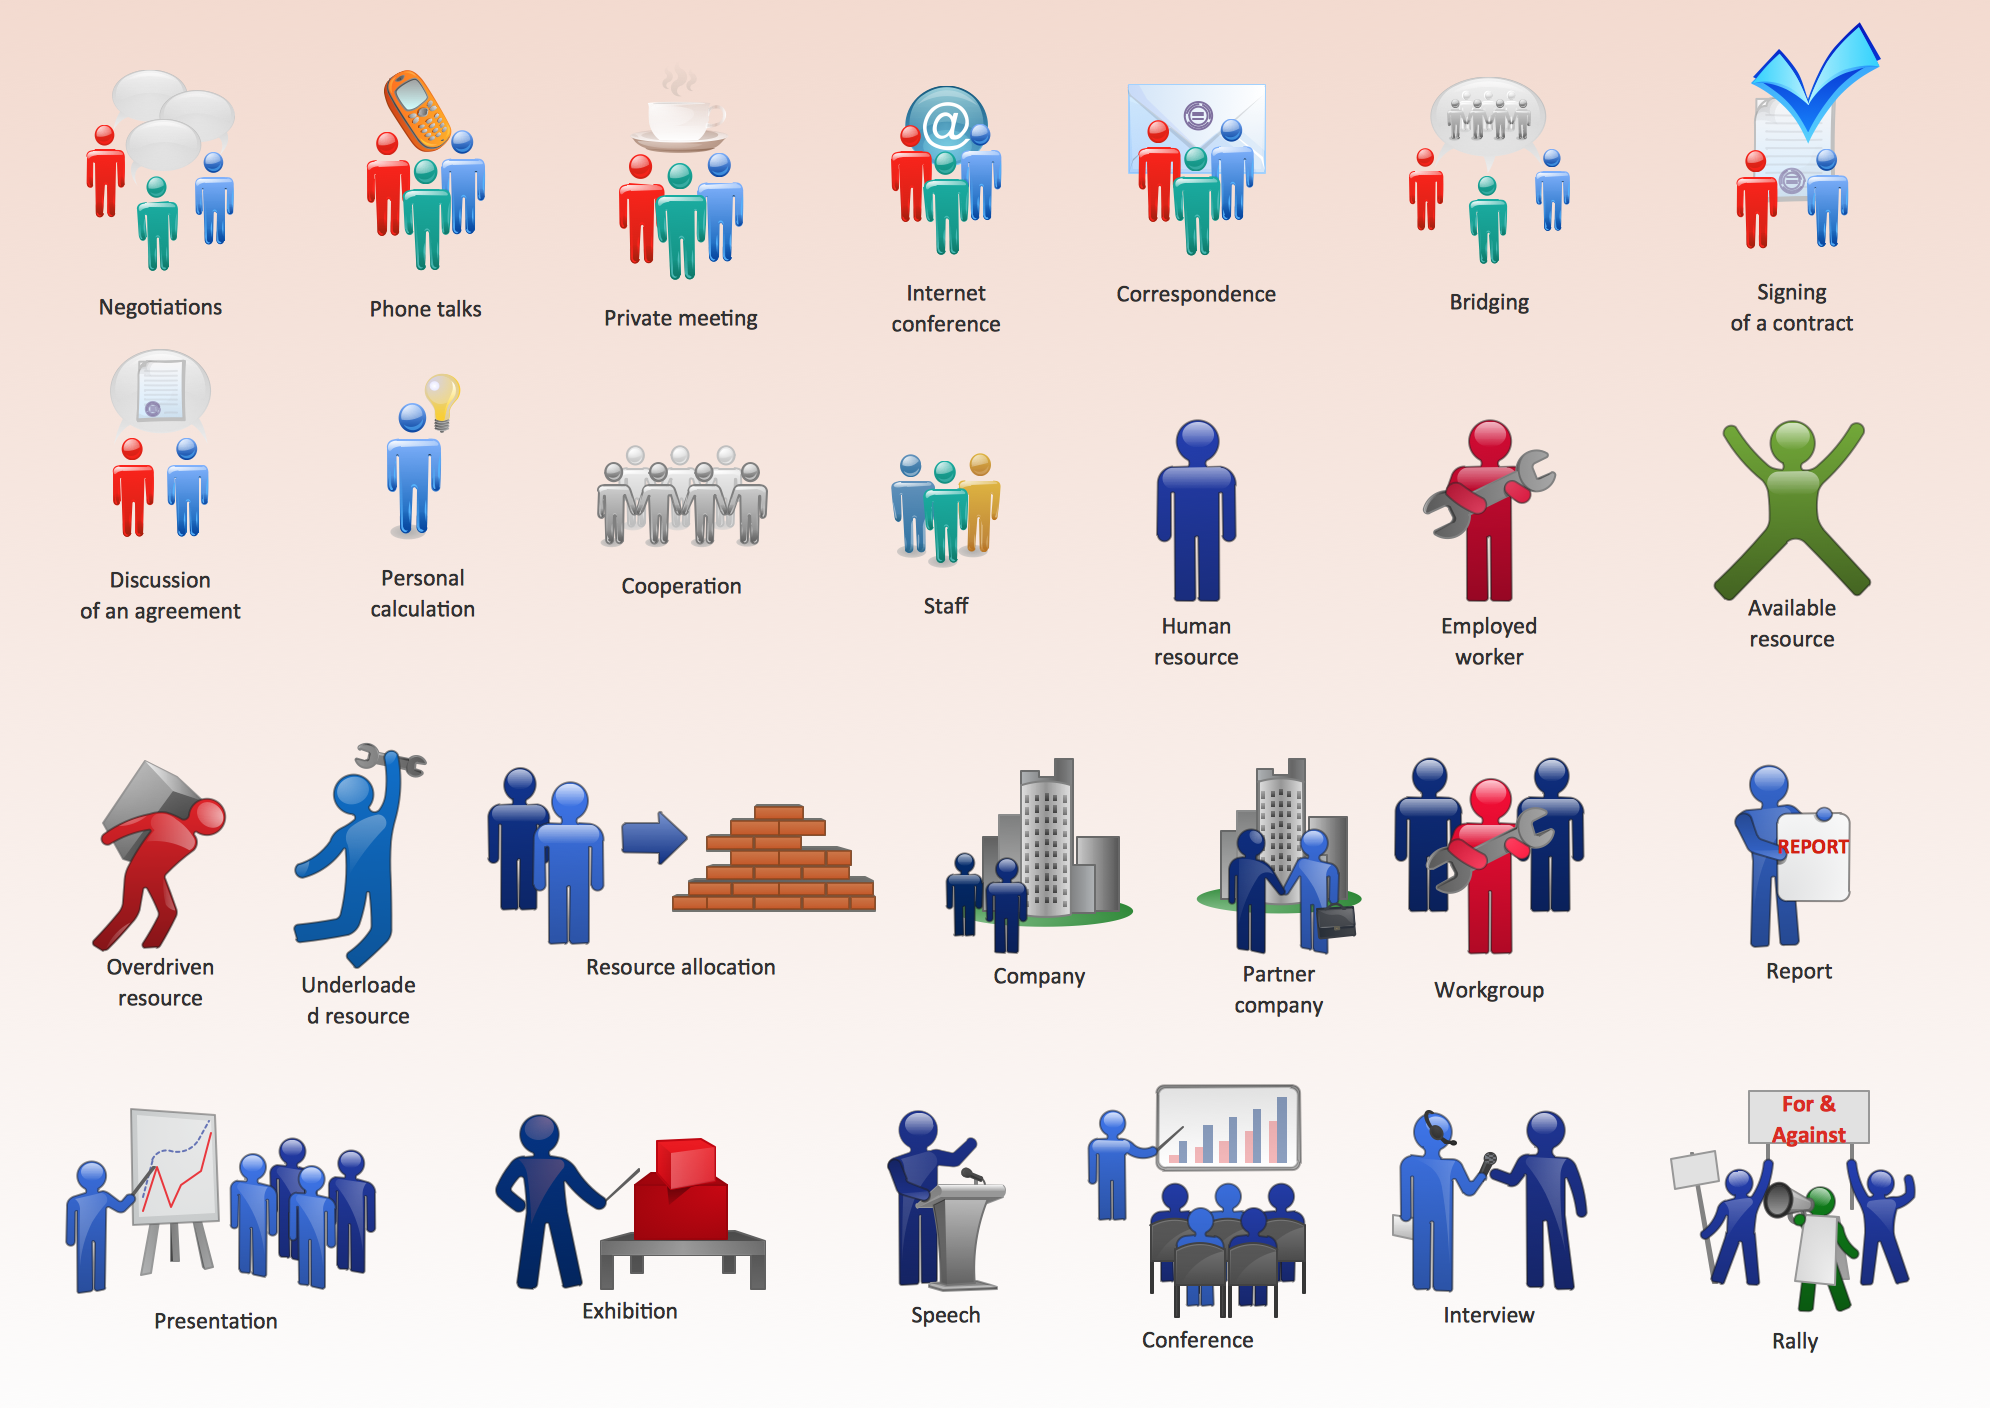
Picture: Business People Figures
Related Solution:
Engineering students usually have huge amount of homework. Learning how to develop a technical drawing is one of the necessary skills. Luckily, at the present time, there’s no need to draw it on paper, because there a lot of software tools for it.
This drawing represents the Bearing symbols library, that is the part of the ConceptDraw Mechanical Engineering solution. Bearings are the important components of any movable mechanism. The function of bearing is to align, guide, and support the moving parts in any mechanical construction. Usually they are located between moving and stationary parts, it works as a connection point between them. Using Mechanical Engineering solution and ConceptDraw DIAGRAM one can effortlessly draw engineering diagrams of any complexity.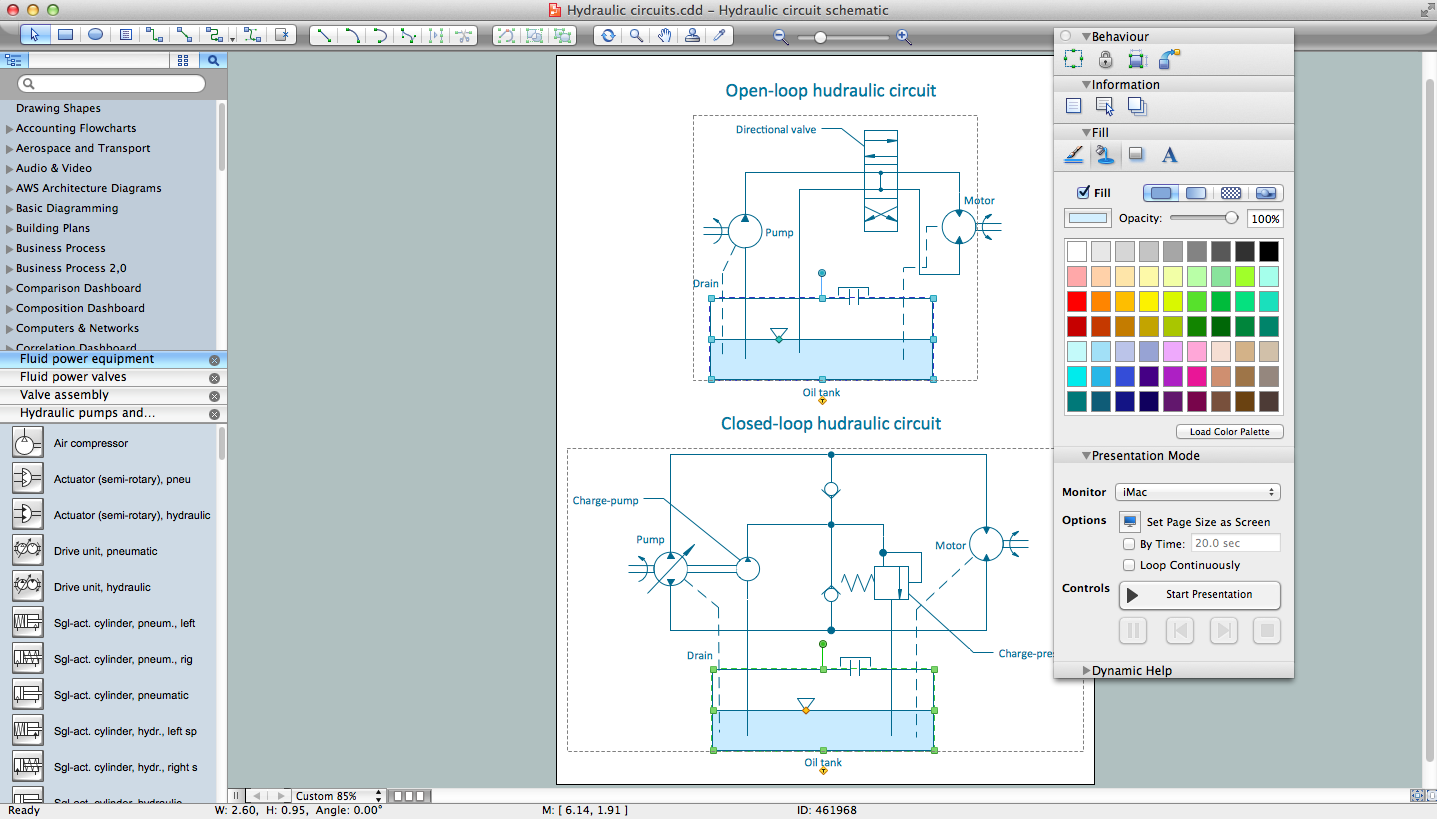
Picture: Technical Drawing Software
Related Solution:
ConceptDraw DIAGRAM diagramming and vector drawing software extended with Mac OS User Interface Solution from the Software Development area is a powerful Mac OS GUI Software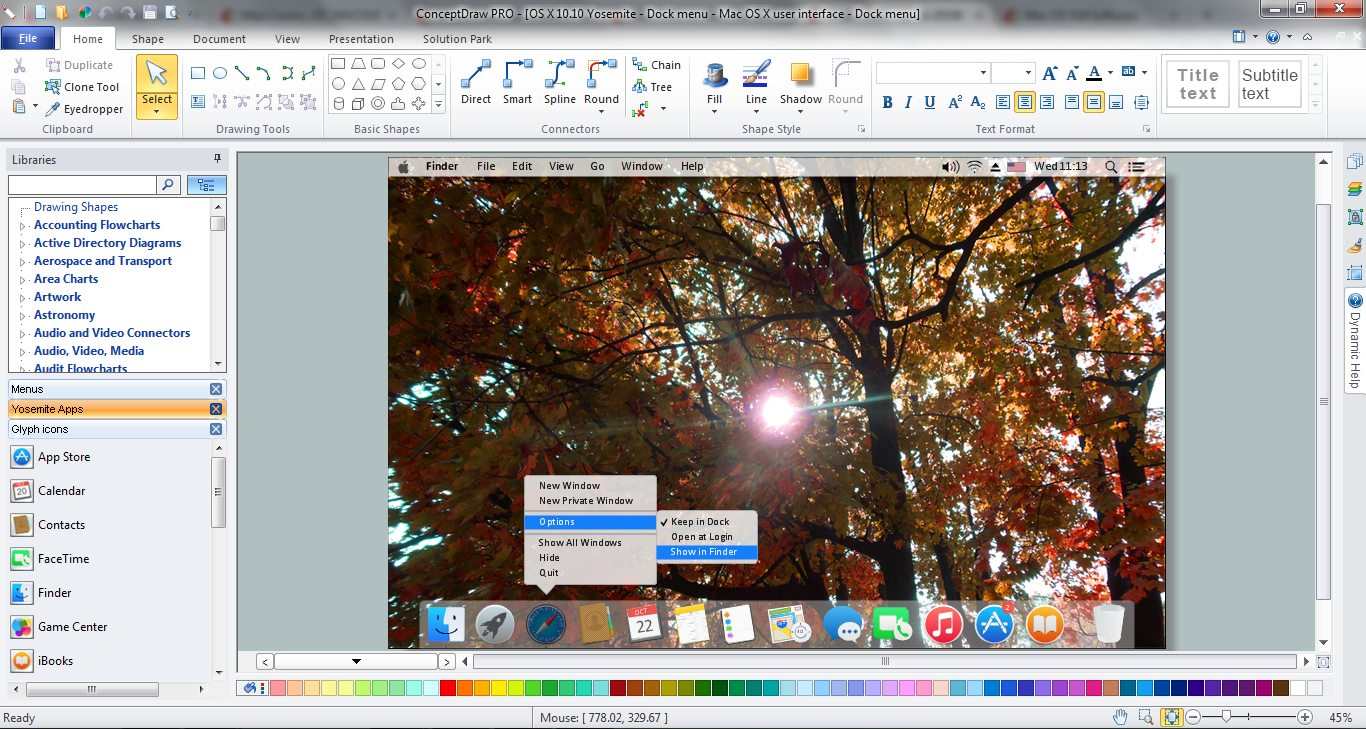
Picture: Mac OS GUI Software
Related Solution:
ConceptDraw DIAGRAM Comparison with Omnigraffle Professional and MS Visio. All source ConceptDraw documents are vector graphic documents. They are available for reviewing, modifying, or converting to a variety of formats: PDF file, MS PowerPoint, MS Visio, and many other graphics formats.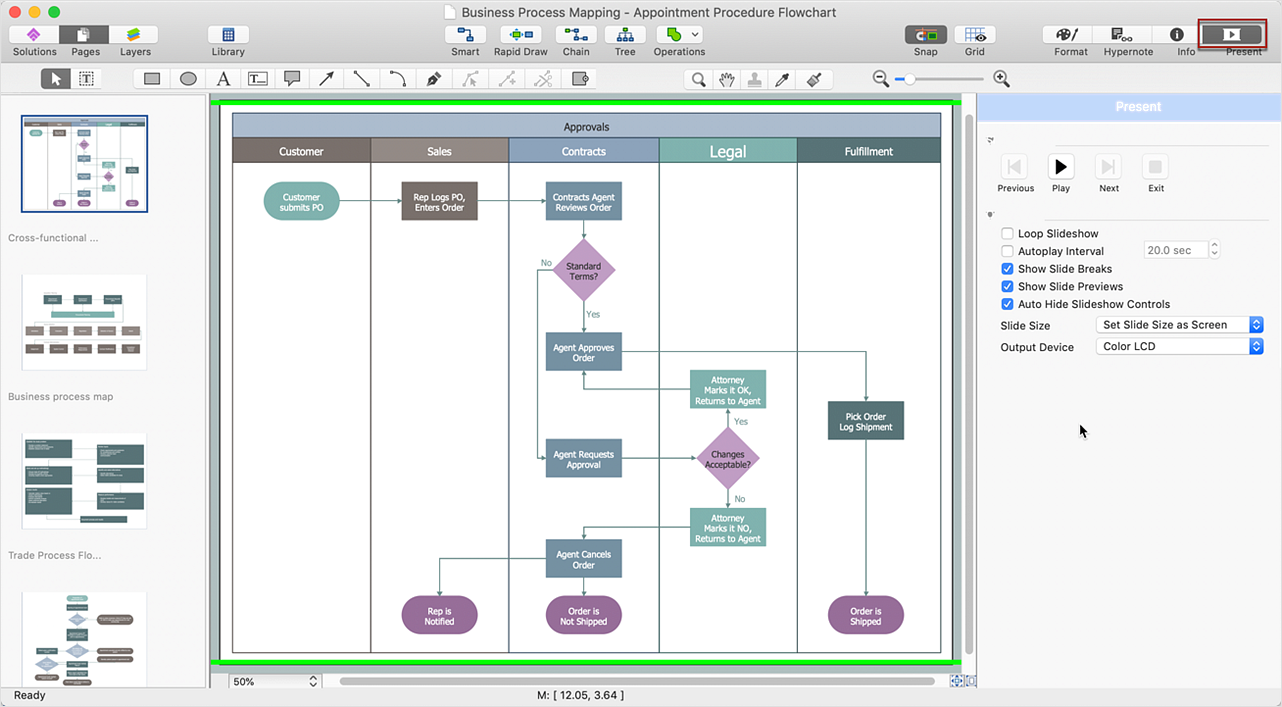
Picture: ConceptDraw DIAGRAM Comparison with Omnigraffle Professional and MS Visio
Related Solution:
ConceptDraw Pyramid Diagram software allows drawing column charts using predesigned objects or drawing tools. In ConceptDraw Pyramid Diagram software you can find a complete set of column chart tools and objects.
Picture: How to Create a Pyramid Diagram
Related Solutions:
Perfect charts and graphics diagramming software with rich examples and template. ConceptDraw is ideal to draw Charts and Graphics.
Picture: Basic Diagramming
Related Solution:
A Storage area network (SAN) is a dedicated network that provides access to data storage and operations only on the block level. SAN usually has own network of storage devices/elements and disk arrays that are connected with each other and to a remote data-sharing network. SANs are widely used for enhancing the storage devices (optical jukeboxes, disk arrays, tape libraries) that are accessible for networked servers.
This example was created in ConceptDraw DIAGRAM using the Computer and Networks Area of ConceptDraw Solution Park. It shows the hybrid of Storage area network (SAN) and Network Attached Storage (NAS) technologies.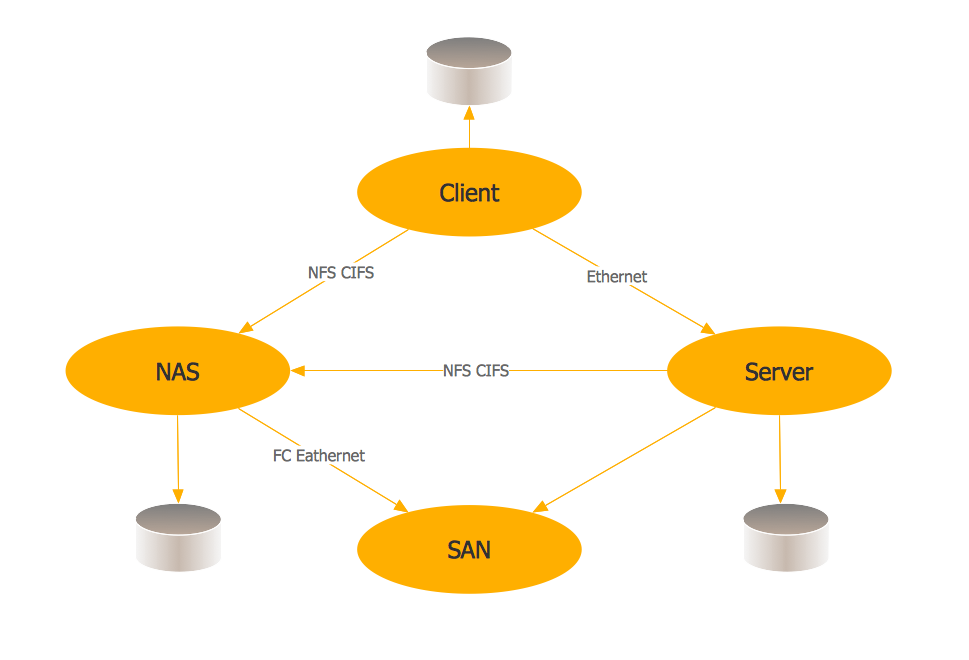
Picture: Storage area networks (SAN). Computer and Network Examples
Related Solution:
ConceptDraw DIAGRAM compatible Mac OS X software extended with powerful Entity-Relationship Diagram (ERD) Solution from the Software Development Area for ConceptDraw Solution Park is one of the famous ER Diagram Programs for Mac. It gives the perfect ability to draw ER diagrams for visually describing databases with Chen's and Crow's Foot notation icons.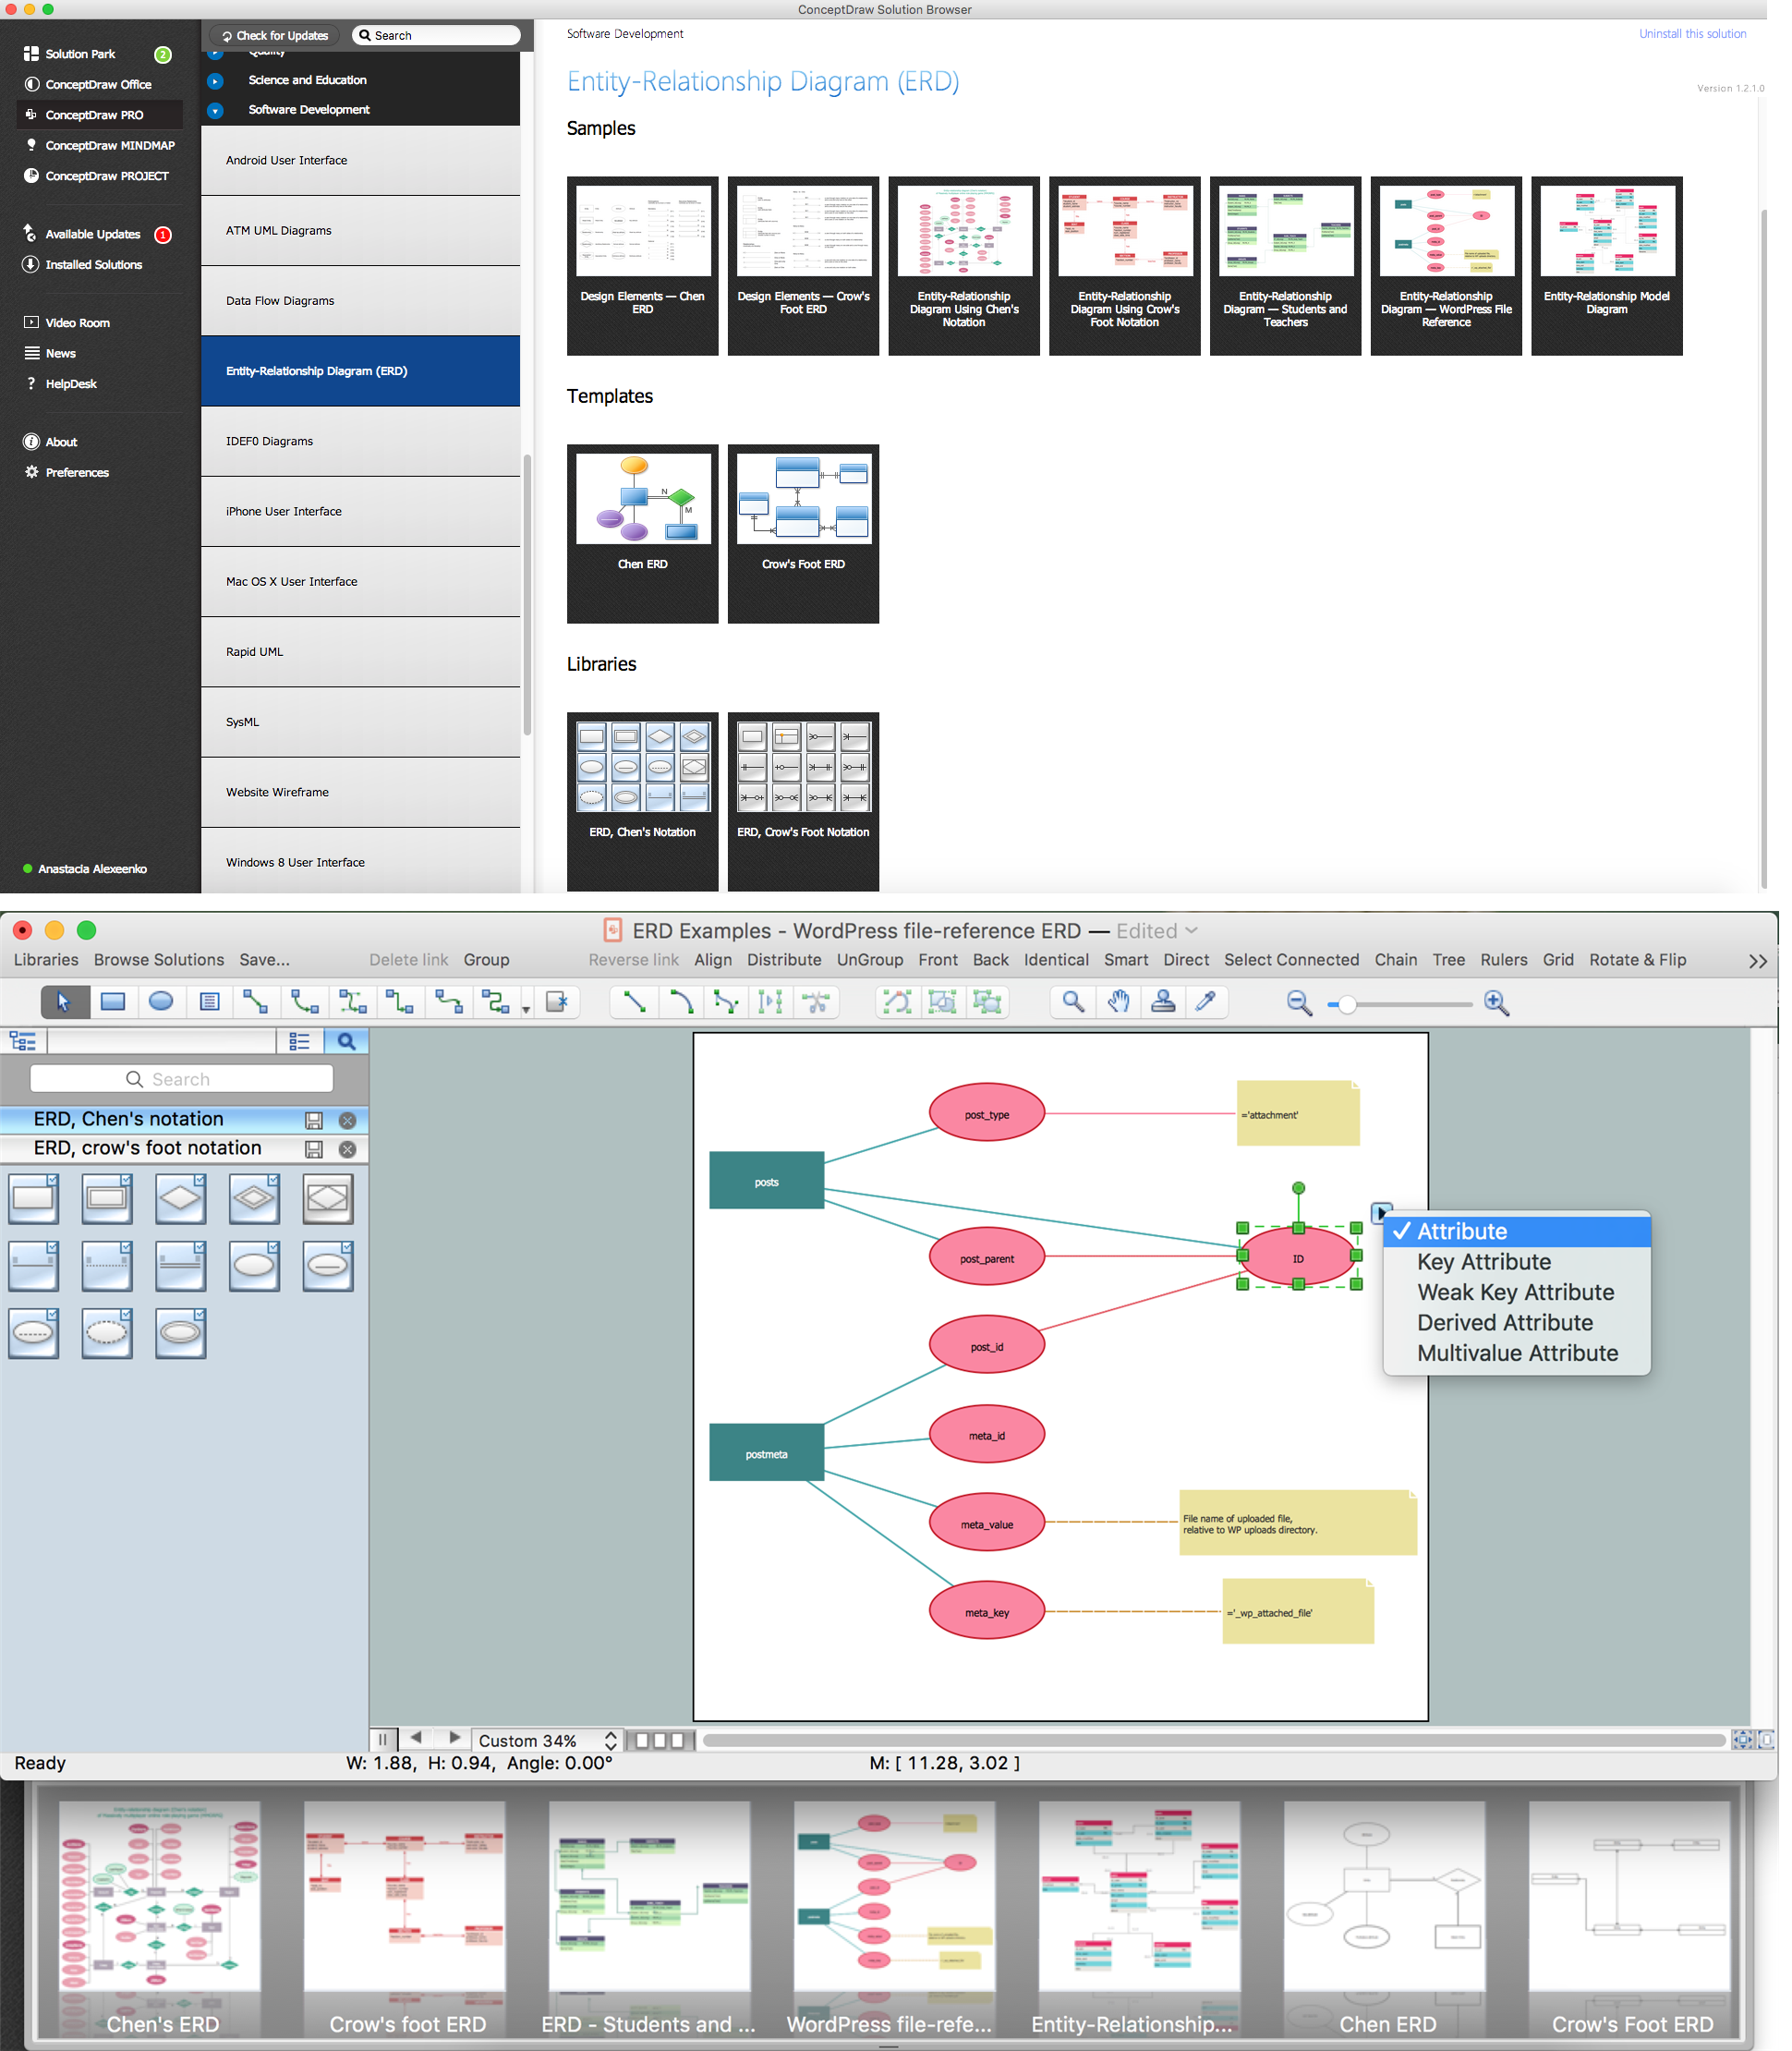
Picture: ER Diagram Programs for Mac
Related Solution:
Business graphic applications show a special knowledge representations and include many features for creating schematic pictures. These graphic tools are known as flowchart maker or flowchart maker software.
Picture: Flowchart Maker
Related Solution:
The Architecture Diagrams are the type of diagrams which help to system designers, system developers, and application developers to visualize the overall high-level structure of the system or application and depict the interactions between software systems, users, external systems, data sources, and services. The ConceptDraw DIAGRAM Architecture Diagrams Software provides the unique Cloud Computing Diagrams solution from the Computers and Network area of ConceptDraw Solution Park with wide set of powerful tools for fast and easy creating various types of Architecture diagrams.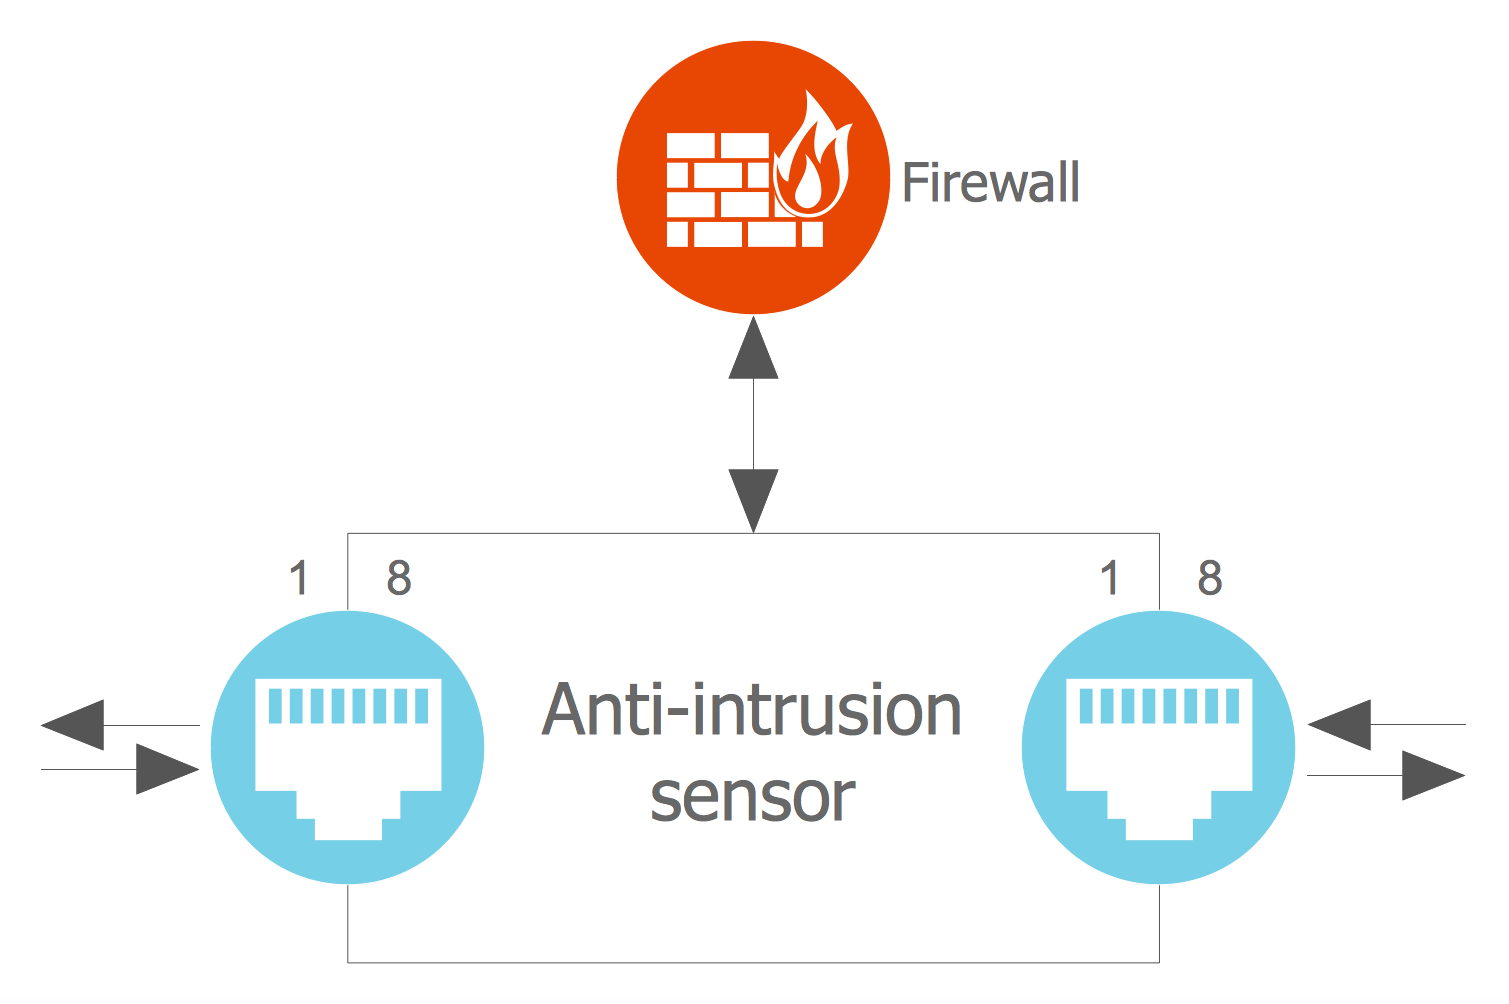
Picture: Architecture Diagrams
Related Solution:


