Using the libraries of the Business Process Diagram Solution for ConceptDraw DIAGRAM you can create your own professional Business Process Diagrams quick and easy.
NINE RELATED HOW TO's:
Use ConceptDraw DIAGRAM with Accounting Flowcharts solution to document and communicate visually how accounting processes work, and how each operation is done.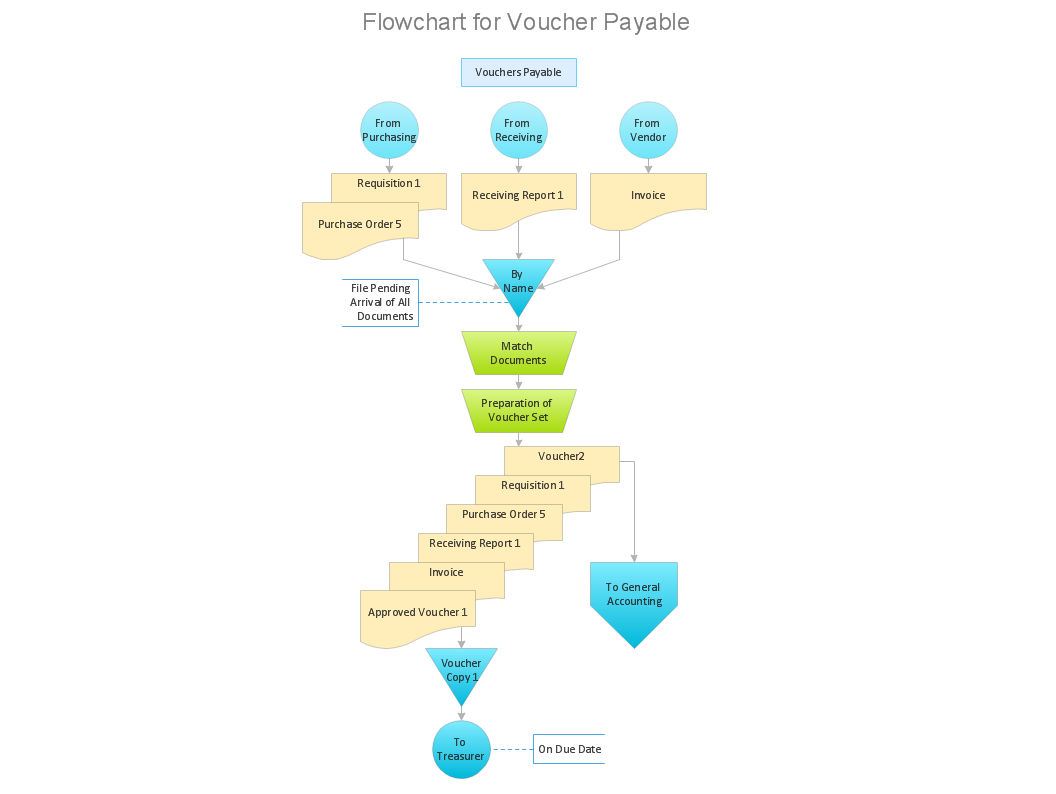
Picture: Accounting Flowchart: Purchasing, Receiving, Payable and Payment
Related Solution:
Video tutorials on ConceptDraw products. Try it today!
Picture: What can you create with ConceptDraw MINDMAP?
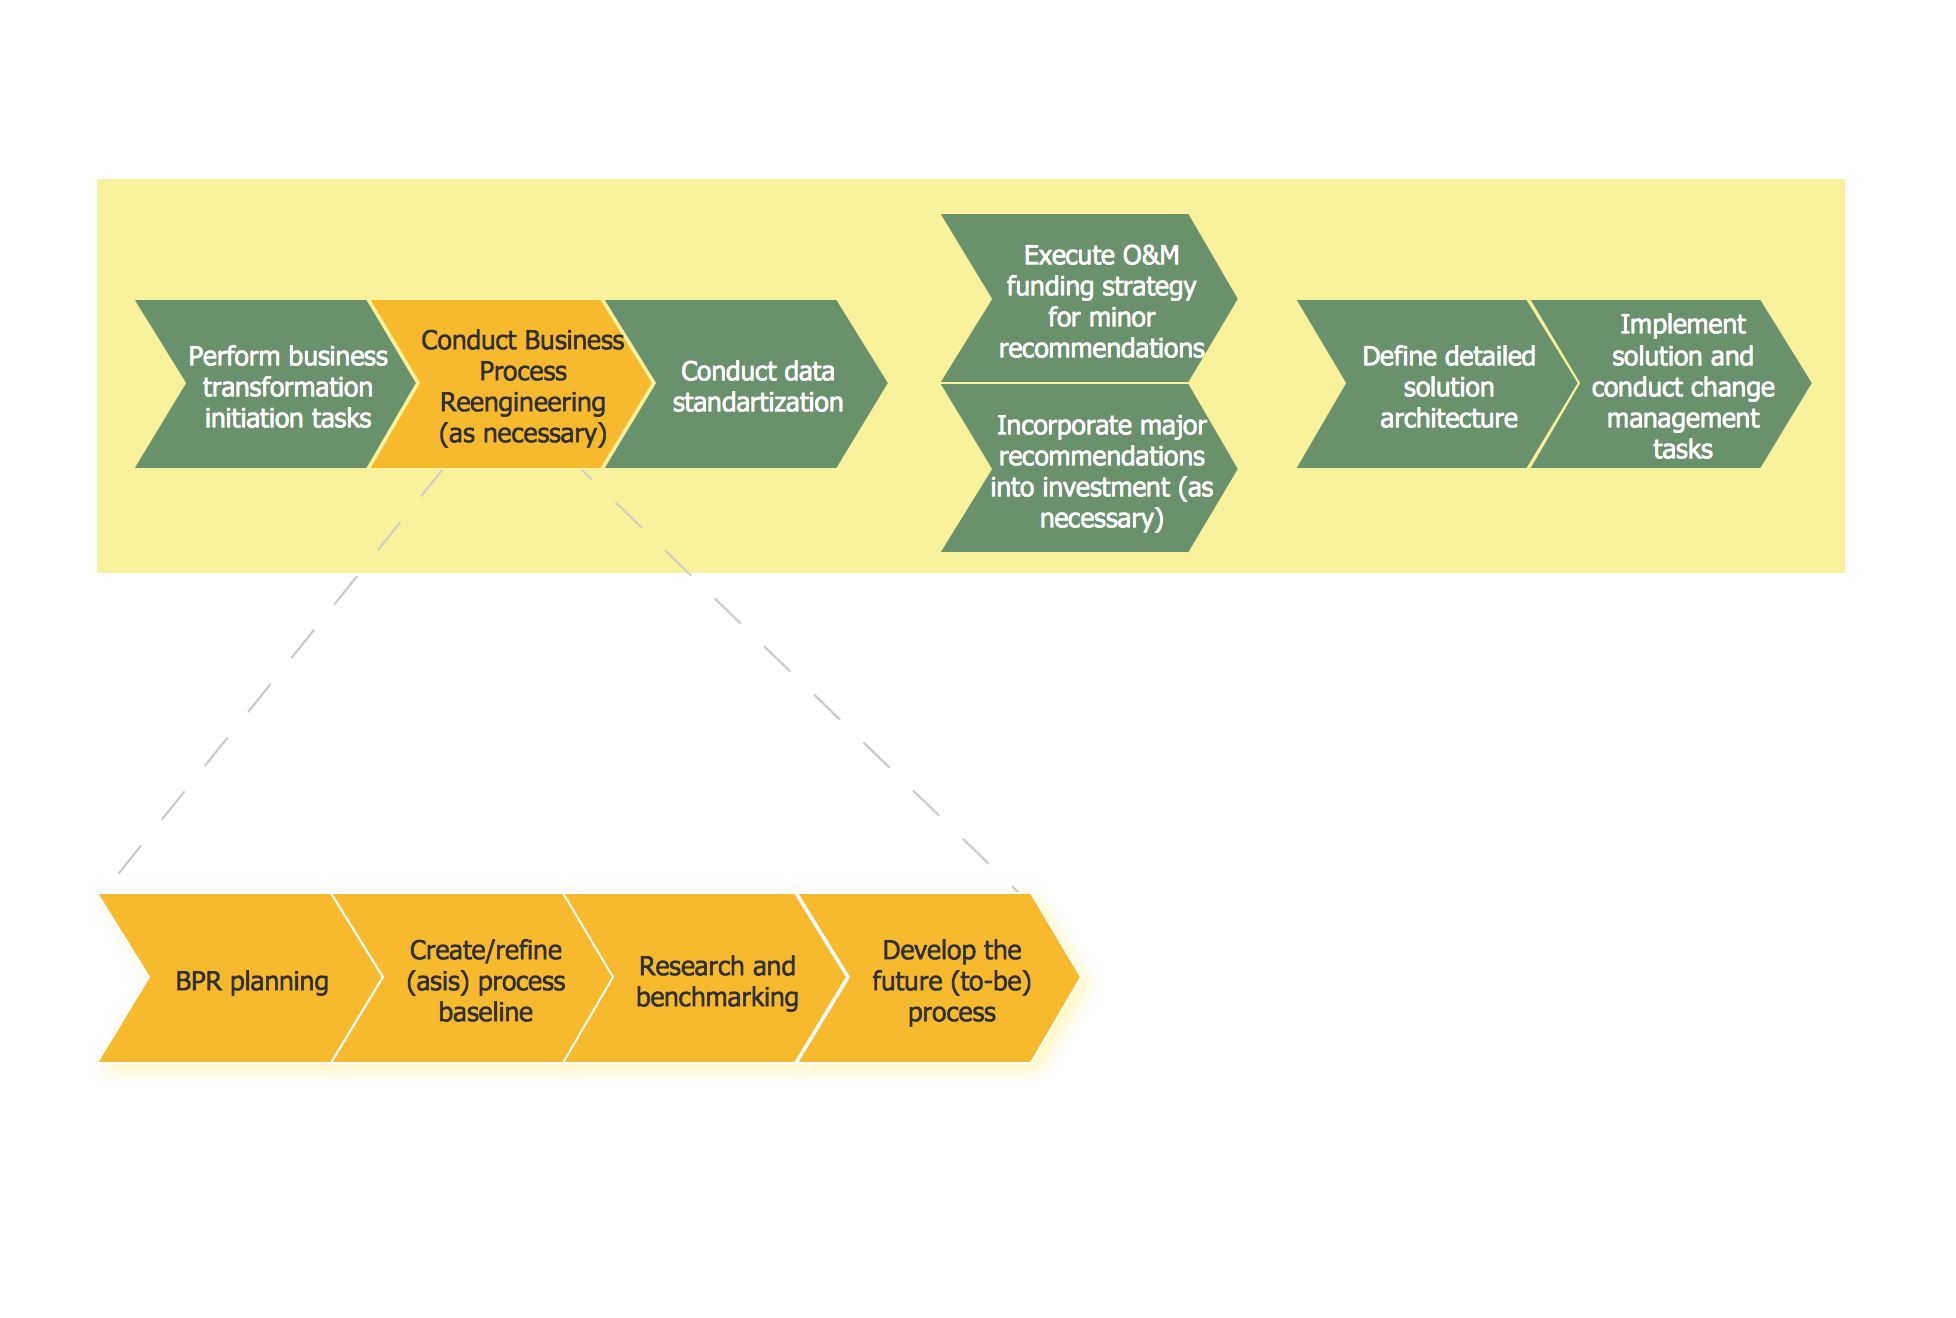
The Process Flowchart or Process Flowchart Diagram (PFD) is a visual representation relations between major parts of the system, the steps in a process, and even connections between various systems. The possibility to easy create professional-looking and attractive Process Flowcharts, Business Process Diagrams and Maps which visualize the steps of complex processes is provided by Business Process Diagram Solution from the Business Processes Area of ConceptDraw Solution Park and 16 libraries with 230 process flowchart symbols from BPMN 1.2 and BPMN 2.0.
Picture: Process Flowchart Symbols
Related Solution:
Sales process management is a business discipline which focuses on the development and practical application of various sales techniques, and on the management of sales operations of the company.
It is effective to use professional software for the sales process management. ConceptDraw DIAGRAM diagramming and vector drawing software extended with Sales Flowcharts solution from the Marketing area of ConceptDraw Solution Park is the best choice.

Picture: Sales Process Management
Related Solution:
The ConceptDraw DIAGRAM is a good flow chart app for Mac. Numerous vector stencils, samples and templates created by designers allows you to draw any type of flowchart.
Picture: Good Flow Chart app for Mac
Related Solution:
Create professional business process diagrams using ConceptDraw Activities library with 34 objects from BPMN.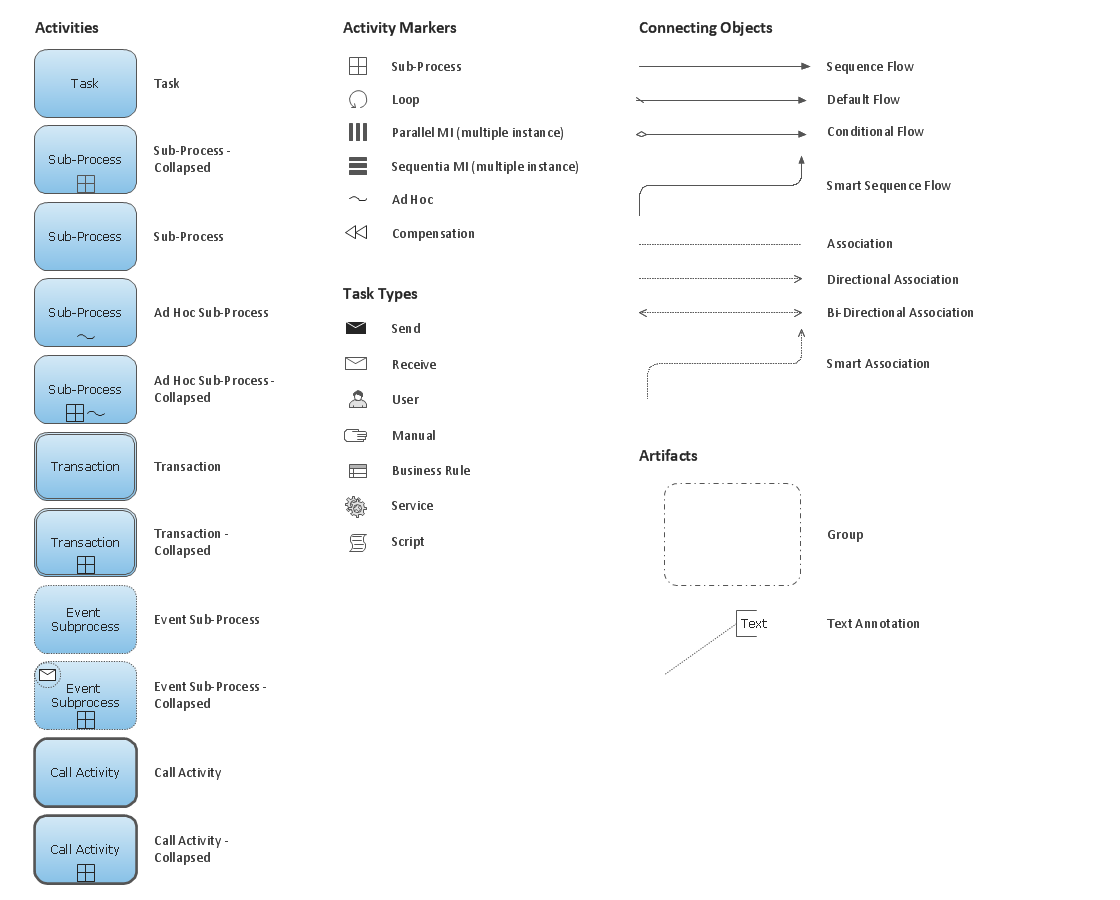
Picture: Business Process Model and Notation Elements: Activities
Communication is the main challenge and the key success factor for organizational project management in company with remote projects. Communicating visually via Skype you bring all projects together to achieve corporate goals.
Picture: Remote Projects in Corporate Strategy
Related Solution:
ConceptDraw Flowcharts visualize a process or algorithm of program as step/operation blocks of various shapes connected with arrowed lines showed the process flow direction. They are used to visualize business or technical processes and software algorithms.
Picture: Selecting & Creating Flowcharts
Related Solution:
Times when you had difficulties in searching for an appropriate software depending on your OS, had passed. If you still look for a great software to create flowcharts on Mac, here is the answer. ConceptDraw Pro is a great tool for creating diagrams, with tons of samples, libraries and tutorials.
Making flowchart diagram is the best way to represent a process as a sequence of steps. Flowcharting provides a simple way of organizing and representing data so that even complex and detailed processes become clear. That is why using a flowchart software tool is proven to be an ideal for structure and share an information on process workflow structure. This flow chart was created to depict the steps of certification process. This flow chart was created using ConceptDraw DIAGRAM software for Apple OS X. The Rapid Draw technology was used to create this flow chart. ConceptDraw DIAGRAM also supports popular Apple OS X features such as Quick Look, Full-Screen Mode, Version Browsing and Autosave. You can export your multi-page diagrams to SVG or graphic formats such as TIFF, JPEG, PNG and PDF.
Picture: Create Flow Chart on Mac: The Comprehensive Guide
Related Solution: