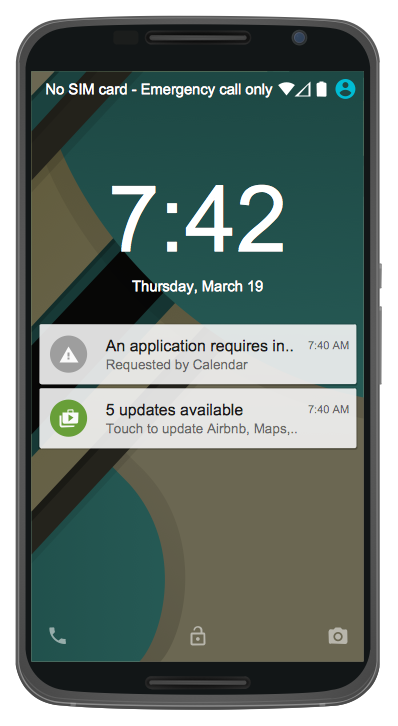
Example 1. Android UI Design - Android 5.0 Lock Screen Notifications
Android User Interface Solution offers 30 libraries:
- Android UI
- Android Wallpapers
- Android Product Icons
- Android Lists
- Android Switches and Sliders
- Android Menus
- Android Buttons
- Android Grids
- Android Snackbars and Toasts
- Android Notifications
- Android Bottom Sheets
- Android Chips
- Android Cards
- Android Dialogs
- Android Tabs
- Android Text Fields
- Android System Icons (action, alert)
- Android System Icons (av)
- Android System Icons (communication)
- Android System Icons (content)
- Android System Icons (device)
- Android System Icons (editor)
- Android System Icons (file)
- Android System Icons (hardware)
- Android System Icons (image)
- Android System Icons (maps)
- Android System Icons (navigation)
- Android System Icons (notification)
- Android System Icons (social)
- Android System Icons (toggle)
These libraries contain 1088 predesigned vector graphical elements. Now you don't need to lose the time for drawing components, simply drag them ready from the libraries and arrange them as desired.

Example 2. Android Product Icons Library Design Elements
Don't miss your chance to make quick and easy professional looking Android UI design using the objects from the libraries of Android User Interface Solution. Make your design more attractive using the bright colors and clipart from other ConceptDraw libraries or from outside sources.

Example 3. Android UI Design - Android 5.0 List Style Bottom Sheet
The Android UI Design samples you see on this page were created in ConceptDraw DIAGRAM using the Android User Interface Solution. An experienced user spent 10-15 minutes creating each of them. All these samples are included in Android User Interface Solution and are available for viewing and editing from ConceptDraw STORE.
Use Android User Interface solution for quick, easy and effective Android UI design.
All source documents are vector graphic documents. They are available for reviewing, modifying, or converting to a variety of formats (PDF file, MS PowerPoint, MS Visio, and many other graphic formats) from the ConceptDraw STORE. The Android User Interface Solution is available for all ConceptDraw DIAGRAM or later users.
EIGHT RELATED HOW TO's:
All computer networks differ by various params, and their size is one of them. As global area networks are the biggest, personal area (PAN) networks are the smallest. Personal computers, smartphones and other devices that have possibility to connect to Internet form a personal network.
This diagram was created using ConceptDraw Computer Network Diagrams to represent a typical components of Personal area network. A personal area network (PAN) is the connection of IT devices around an individual person. This sample of personal area network involves a notebook, a personal digital assistant (PDA), and a portable printer. Commonly a PAN contains such wireless devices as mouse, keyboard, smartphone and tablet. A wireless connection is typical for a PAN.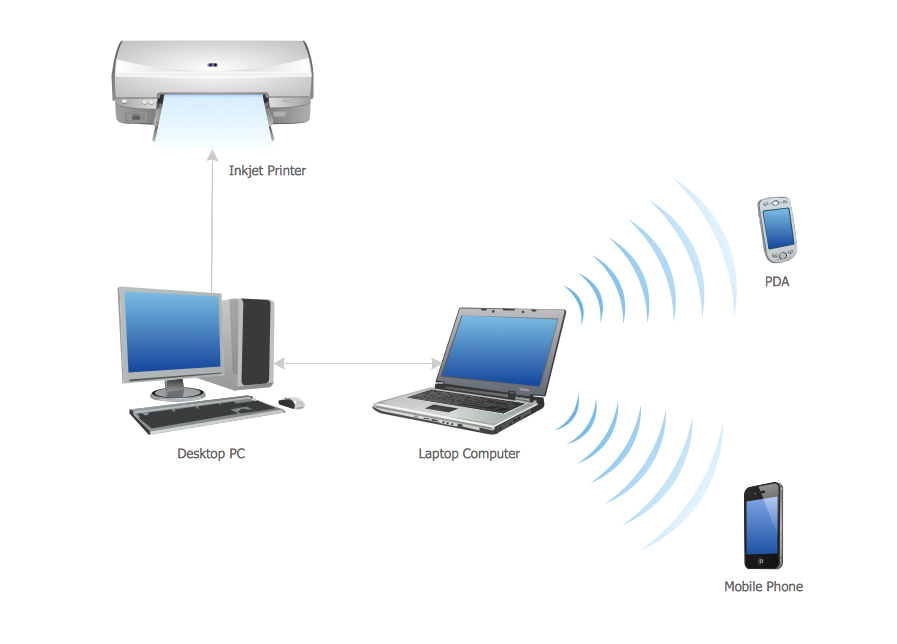
Picture: Personal area (PAN) networks. Computer and Network Examples
Related Solution:
No need for any special drawing skills to create professional looking diagrams outside of your knowledge base. ConceptDraw DIAGRAM takes care of the technical details, allowing you to focus on your job, not the drawing.
ConceptDraw DIAGRAM delivers full-functioned alternative to MS Visio. ConceptDraw DIAGRAM supports import of Visio files. ConceptDraw DIAGRAM supports flowcharting, swimlane, orgchart, project chart, mind map, decision tree, cause and effect, charts and graphs, and many other diagram types.
Picture: MS Visio Look a Like Diagrams
The Android operating system is one of the most popular platforms today. It was developed and now used on smartphones, tablets, netbooks, smartbooks, and many other electronic devices, and combines the reliability, flexibility and ease of use.
So, millions of people face daily with Android operating system on their devices, and thus one of important things for the developers of Android applications is developing of convenient and attractive Android UI design. ConceptDraw DIAGRAM diagramming and vector drawing software extended with Android User Interface Solution from the Software Development Area will help you in this.Picture: Android UI Design
Related Solution:
ConceptDraw DIAGRAM is the only application on the Macintosh platform, supplied with a comprehensive Cisco icon set. For graphic solutions that support Windows, only Microsoft Visio has a library of Cisco shapes. ConceptDraw DIAGRAM is a valuable option to many network professionals that use Macintosh computers or work in a combined Mac and PC environment.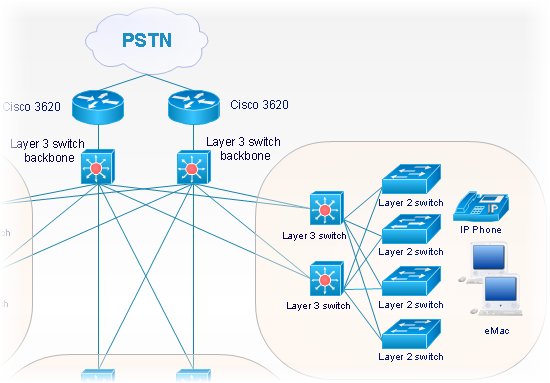
Picture: Cisco Network Objects in ConceptDraw DIAGRAM
For documenting the Cloud Computing Architecture with a goal to facilitate the communication between stakeholders are successfully used the Cloud Computing Architecture diagrams. It is convenient and easy to draw various Cloud Computing Architecture diagrams in ConceptDraw DIAGRAM software with help of tools of the Cloud Computing Diagrams Solution from the Computer and Networks Area of ConceptDraw Solution Park.
Picture: Cloud Computing Architecture Diagrams
Related Solution:
The Wireless Network solution helps users to quickly transition from an idea to the implementation of a wireless computer network.
ConceptDraw DIAGRAM is well placed to provide experienced and comprehensive assistance in the workplace.
The vector stencils, examples, and templates included to solution is a strong toolset for network engineer.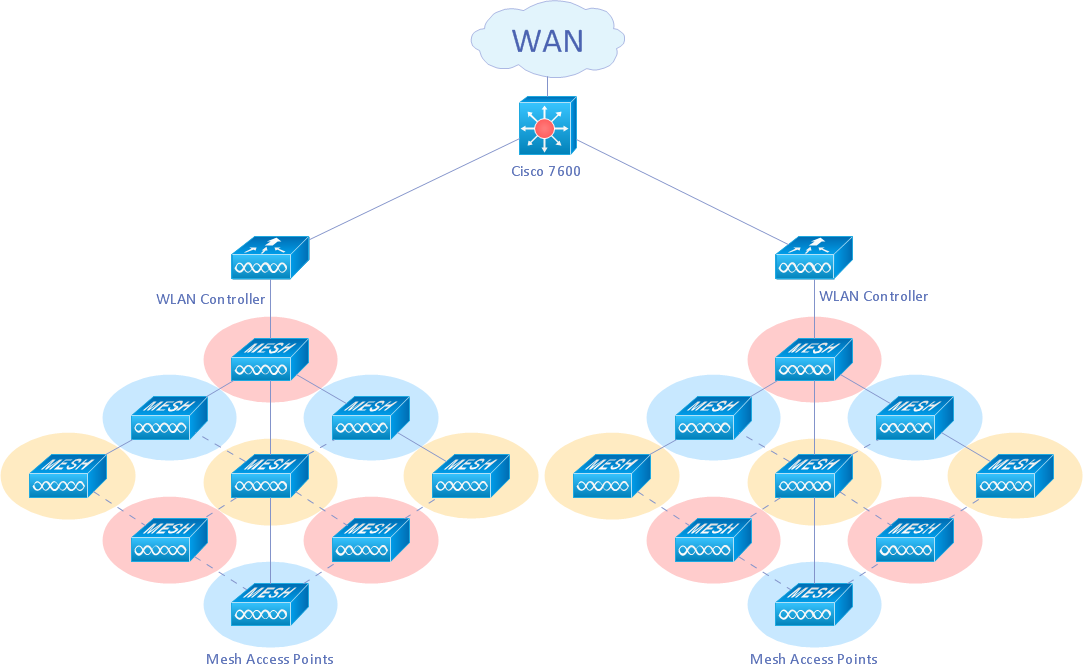
Picture: Wireless Network Drawing
Related Solution:
When trying to figure out the nature of the problems occurring within a project, there are many ways to develop such understanding. One of the most common ways to document processes for further improvement is to draw a process flowchart, which depicts the activities of the process arranged in sequential order — this is business process management. ConceptDraw DIAGRAM is business process mapping software with impressive range of productivity features for business process management and classic project management. This business process management software is helpful for many purposes from different payment processes, or manufacturing processes to chemical processes. Business process mapping flowcharts helps clarify the actual workflow of different people engaged in the same process. This samples were made with ConceptDraw DIAGRAM — business process mapping software for flowcharting and used as classic visio alternative because its briefly named "visio for mac" and for windows, this sort of software named the business process management tools.
This flowchart diagram shows a process flow of project management. The diagram that is presented here depicts the project life cycle that is basic for the most of project management methods. Breaking a project into phases allows to track it in the proper manner. Through separation on phases, the total workflow of a project is divided into some foreseeable components, thus making it easier to follow the project status. A project life cycle commonly includes: initiation, definition, design, development and implementation phases. Distinguished method to show parallel and interdependent processes, as well as project life cycle relationships. A flowchart diagram is often used as visual guide to project. For instance, it used by marketing project management software for visualizing stages of marketing activities or as project management workflow tools. Created with ConceptDraw DIAGRAM — business process mapping software which is flowcharting visio alternative or shortly its visio for mac, this sort of software platform often named the business process management tools.
Picture: Process Flowchart: A Step-by-Step Comprehensive Guide
Related Solution:
Chemical and Process Engineering solution contains variety predesigned process flow diagram elements relating to instrumentation, containers, piping and distribution necessary for chemical engineering, and can be used to map out chemical processes or easy creating various Chemical and Process Flow Diagrams in ConceptDraw DIAGRAM.
Picture: Process Flow Diagram Symbols
Related Solution:
