Seven Management and Planning Tools
This solution extends ConceptDraw DIAGRAM software with a powerful set of business-oriented diagrams that help you to solve complex management problems.
They comprise of an Affinity diagram, Relations diagram, Prioritization matrix, Root cause analysis tree diagram, Involvement matrix, PERT chart, Risk diagram (PDPC).
-
Install this solution Free -
What I need to get started -
Solution Requirements - This solution requires the following products to be installed:
ConceptDraw DIAGRAM v18 - This solution requires the following products to be installed:
-
Compatibility - Sonoma (14), Sonoma (15)
MS Windows 10, 11 - Sonoma (14), Sonoma (15)
-
Support for this Solution -
Helpdesk
Examples
There are a few samples that you see on this page which were created in the ConceptDraw DIAGRAM application by using the Seven Management and Planning Tools solution. Some of the solution's capabilities as well as the professional results which you can achieve are all demonstrated here on this page.
All source documents are vector graphic documents which are always available for modifying, reviewing and/or converting to many different formats, such as MS PowerPoint, PDF file, MS Visio, and many other graphic ones from the ConceptDraw Solution Park or ConceptDraw STORE. The Seven Management and Planning Tools solution is available to all ConceptDraw DIAGRAM users to get installed and used while working in the ConceptDraw DIAGRAM diagramming and drawing software.
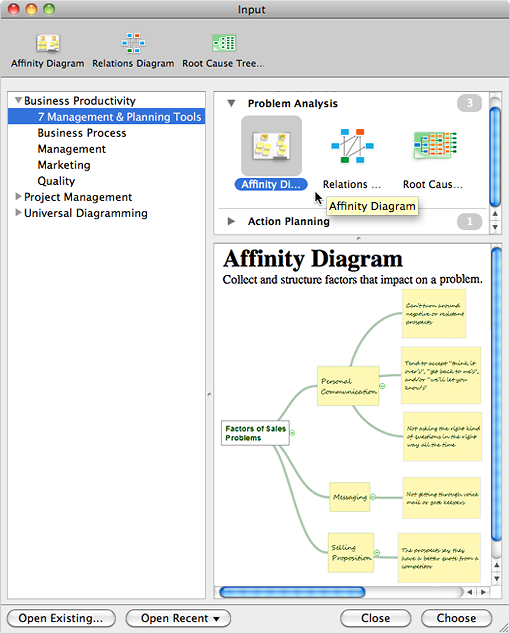
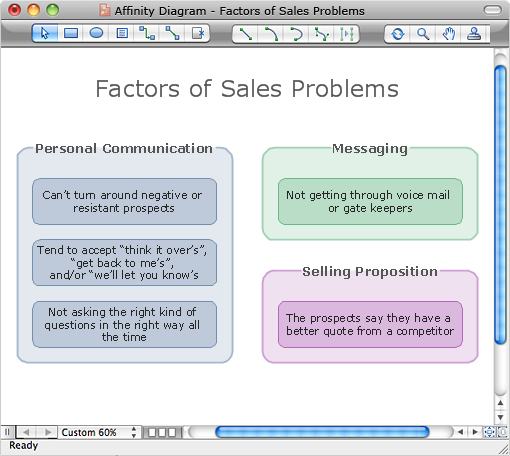
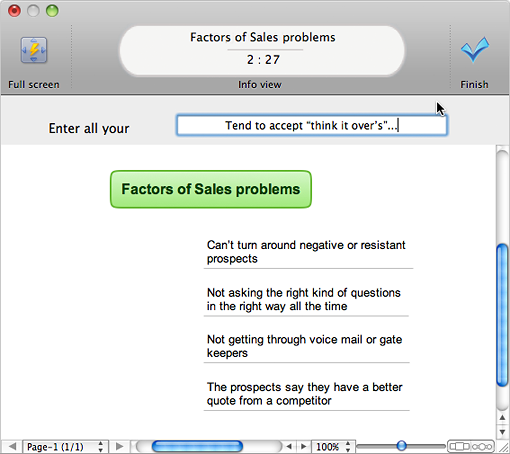
Example1: Affinity Diagram — Implementing Continuous Process Improvement
The seven tools in this solution are closely linked and assist the user in problem solving and analysis. This affinity diagram shows a brief overview of some potential sales problems.

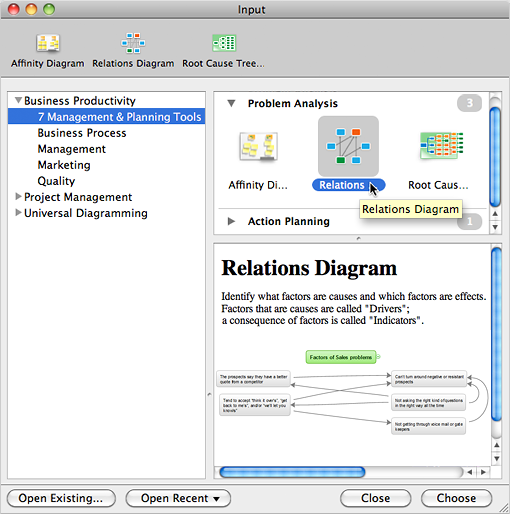
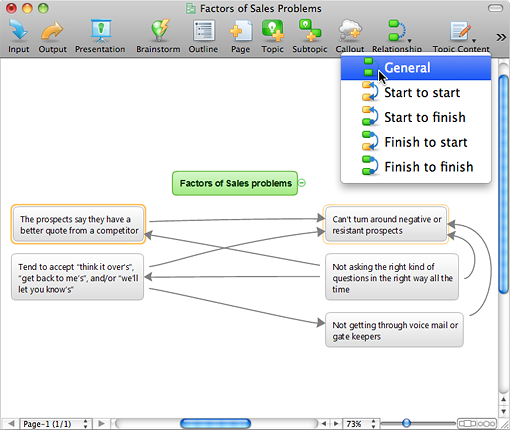
Example 2: Relations Diagram — Health Care
The second example looks a little deeper, and shows an example of how the problems outlined previously can relate to each other.

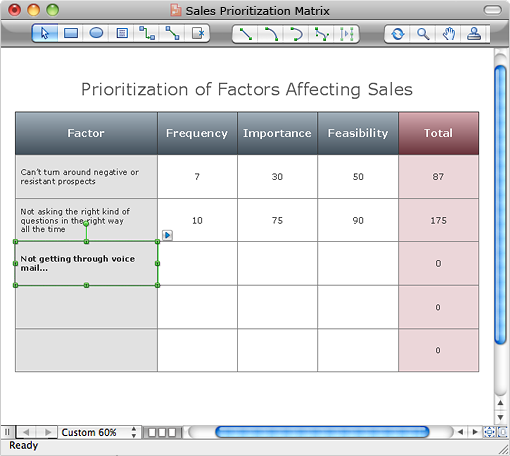
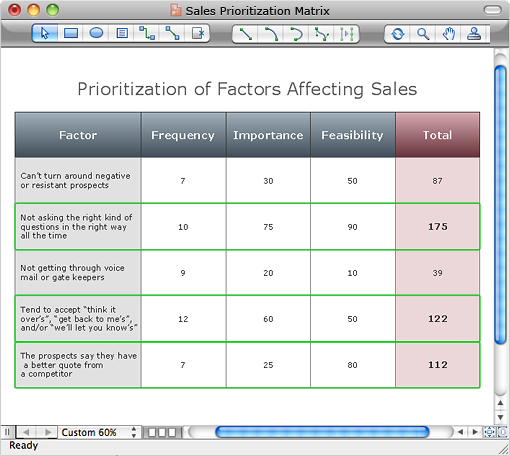
Example 3: Prioritization Matrix — Sales
Once you’ve identified the problems, it’s a good idea to order them in regards to importance and frequency. This matrix gives you the ability to turn theory into quantifiable data.

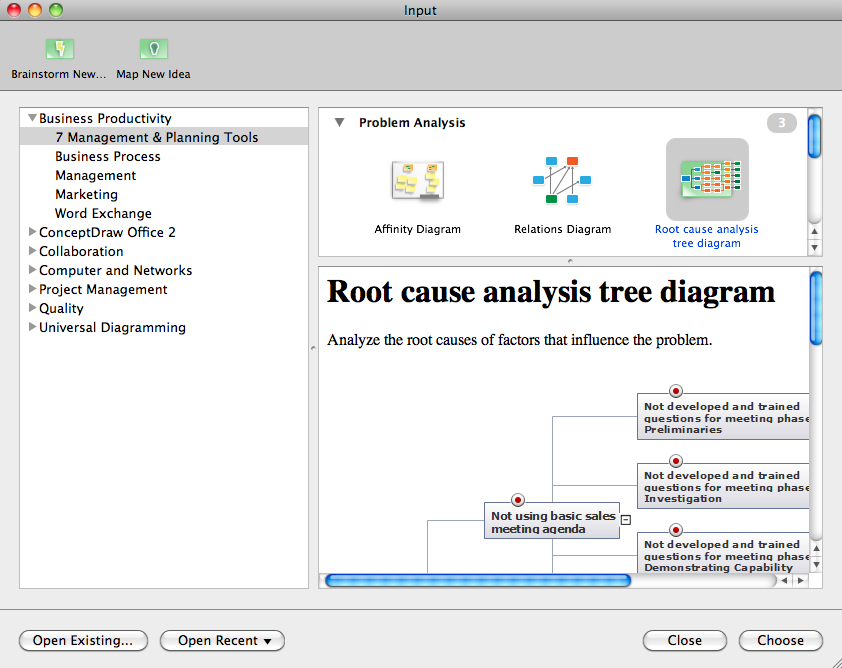
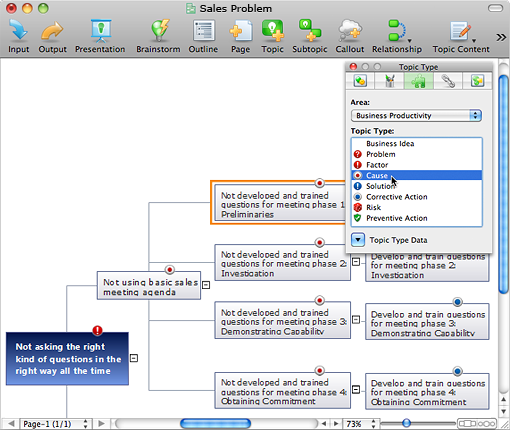
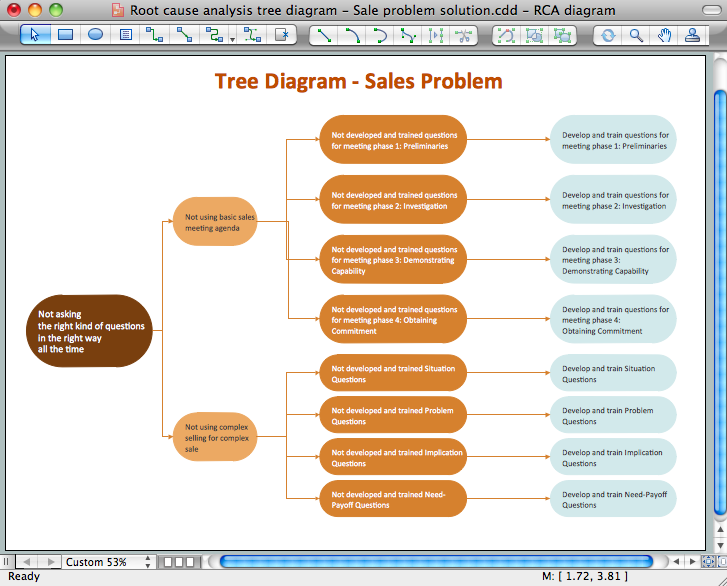
Example 4: Root Cause Analysis Tree Diagram — Personal Problem Solution
With a root cause identified, you can work on causation, and solutions to implement that will address this problem. Problems and solutions are displayed side by side to help when analyzing.

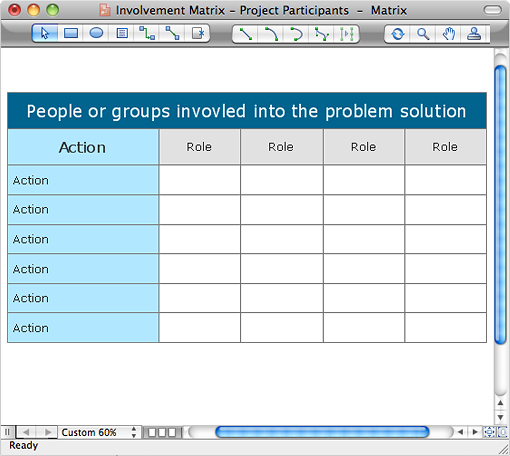
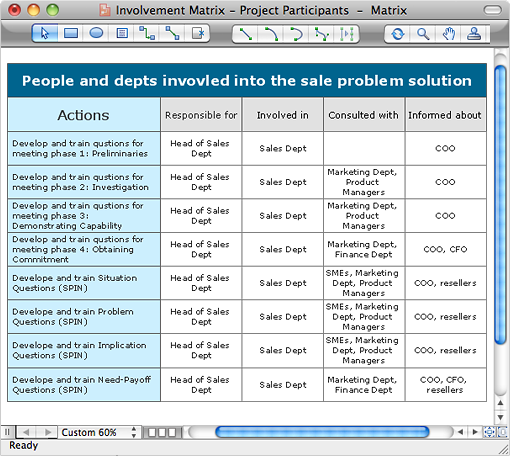
Example 5: Involvement Matrix — Sales
Now that you have a full list of solution processes, you need to assign resources, so actions are carried out correctly and efficiently. The involvement matrix turns a potentially complicated process into an easy to digest chart.

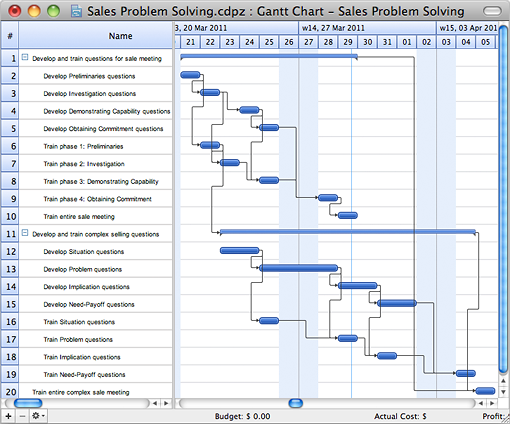
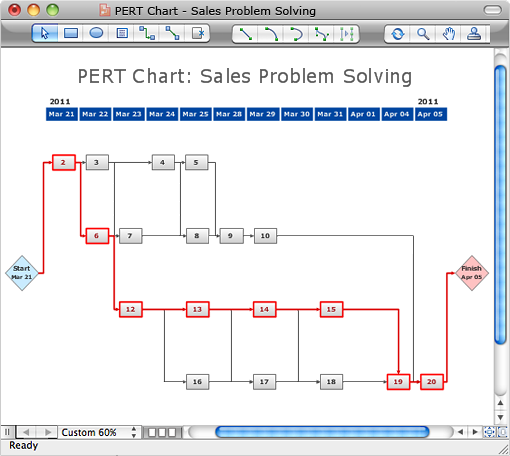
Example 6: PERT Chart — Sales
A PERT Chart gives you a timeline for an entire process. The critical path on this example is highlighted in red.

Example 7: Risk Diagram — Health Care
With all the information gathered from the previous diagrams and tools, it’s possible to create an overall risk diagram. Together, these solutions help you identify and act on any issues that might arise in your business.

What I Need to Get Started
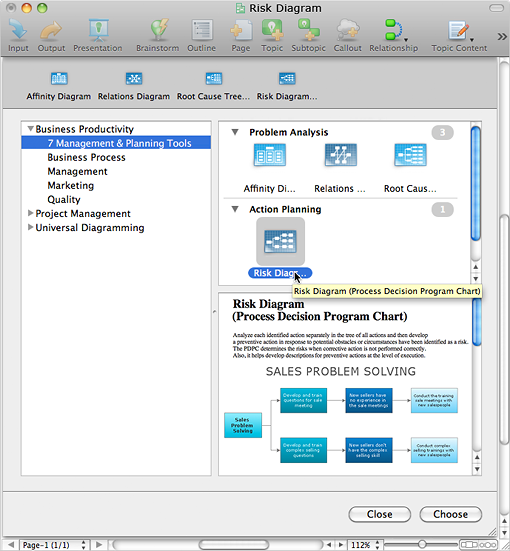
To get started you need ConceptDraw Office 2 and the “7 Management and Planning Tools” solution. You can find the solution in the Business Productivity area of ConceptDraw Solution Park. Install the solution on your computer, using ConceptDraw STORE.
How to install
Download and install ConceptDraw Office and ConceptDraw STORE.
Install “7 Management and Planning Tools” solution using ConceptDraw STORE.
Step 1. Explore the examples of the downloaded solution
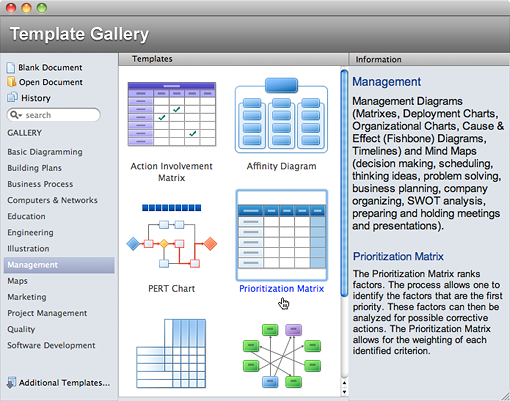
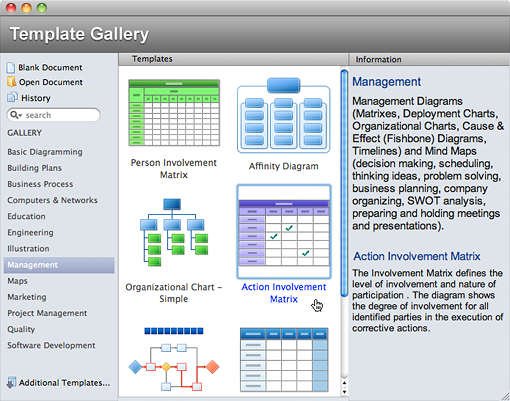
Open ”Management“ category in ConceptDraw DIAGRAM Template Gallery and select any of template, at the bottom will be presented examples. Examples of solution diagrams the solution diagrams contained there are:
- Affinity Diagram
- Relations Diagram
- Prioritization Matrix
- Root Cause Analysis Tree Diagram
- Involvement Matrix
- PERT Chart
- Risk Diagram (PDPC)
Step 2. Create your own documents
Create your own documents using one of the provided templates.
- Affinity Diagram
Affinity Diagram input in Business Productivity Area in ConceptDraw MINDMAP - Relations Diagram
Relations Diagram input in Business Productivity Area in ConceptDraw MINDMAP - Prioritization Matrix
Prioritization Matrix Template in Management Category of ConceptDraw DIAGRAM Template Gallery. - Root Cause Analysis Tree Diagram
Root Cause Analysis Tree Diagram input in Business Productivity Area in ConceptDraw MINDMAP - Involvement Matrix
Action Involvement Matrix Template in Management Category of ConceptDraw DIAGRAM Template Gallery. - PERT Chart
PERT Chart output plugin in ConceptDraw PROJECT Reports. - Risk Diagram (PDPC)
Risk Diagram input in Business Productivity Area in ConceptDraw MINDMAP
Step 3. Present Results
Present your work results. Use ConceptDraw DIAGRAM, ConceptDraw MINDMAP Presentation mode, or MS PowerPoint:
- Display presentation in ConceptDraw DIAGRAM by pressing F5
- Show work results in ConceptDraw MINDMAP by pressing F5
- Export your work documents to MS PowerPoint for sharing with others
How To
Affinity Diagram
How to Group and Structure the Factors That Impact a Problem
First structure factors by groups, then name each group.
The Affinity Diagram shows the structure of large, complex factors that have an influence on a problem, and then divides them up into a smaller and simpler structure. The Affinity Diagram does not show a causal relationship between the factors. This diagram is designed to prepare the data for further analysis of the cause-effect relationships. A typical size for an Affinity Diagram is approximately
How to Structure the Factors of a Problem by Using ConceptDraw Office 2?
- Use “Affinity Diagram” input template in ConceptDraw MINDMAP
- Brainstorm and collect all factors affecting the problem
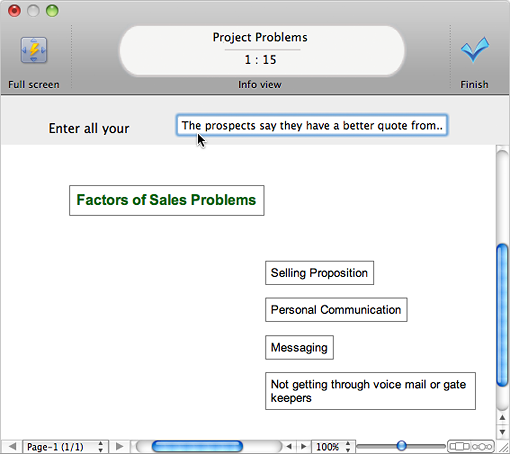
- Organize items into a mind map tree structure that reflects the problem’s composition

- Use Output “Affinity Diagram” to create a diagram from mind map
Relations Diagram
How to Identify Causal Relationships
Identify how factors influence each other. Factors mostly influencing called “Drivers” Primarily affected factors called “Indicators”. Problem solving further focuses on changing driver factors by corrective actions. Indicator factors help establish KPI (Key Performance Indicators) to monitor changes and the effectiveness of corrective actions in resolving a problem.
How to Identify Relationships between Factors Affecting a Problem by Using ConceptDraw Office 2?
- Use “Relations Diagram” input template in ConceptDraw MINDMAP
- Brainstorm and collect all factors affecting problem
- Select all items and drag-drop them on the Main topic
- Create links between factors using the ConceptDraw MINDMAP relations feature
- Use Output “Relations Diagram” to create a Relations Diagram from your mind map. You are now ready to define
factors-drivers andfactors-indicators 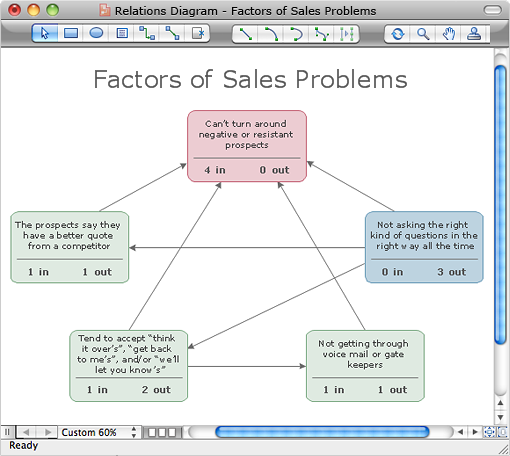
Prioritization Matrix
How to Prioritize the Driver Factors to Order Corrective Actions
The Prioritization Matrix ranks driver factors based on a set of criteria. The process allows one to identify the factors that are the first priority. These factors can then be analyzed for possible corrective actions. The Prioritization Matrix allows the factor weighting for each identified criterion. The total sum of weights for each factor determines the priority.
How to Rank Driver Factors for Priority in ConceptDraw Office 2
- Create new Document using “Prioritization Matrix” template in ConceptDraw DIAGRAM
- Enter criteria, factors, and rank factors
- Select three of the highest priority factors to work with
Root Cause Analysis Tree Diagram
How to Perform Root Cause Analysis
Analyze the root causes of factors that influence the problem. A diagram is constructed separately for each high priority factor. Identify the root causes for a factor and then propose possible corrective actions. The diagram displays the structure of causes for a factor and possible corrective actions. The Root Cause Analysis Tree Diagram is used for further formulation of actions.
How to Identify the Root Causes of a Problem Affecting Factors by Using ConceptDraw Office 2
- Use “Root Cause Diagram” input template in ConceptDraw MINDMAP
- Create a mind map of root cause analysis tree
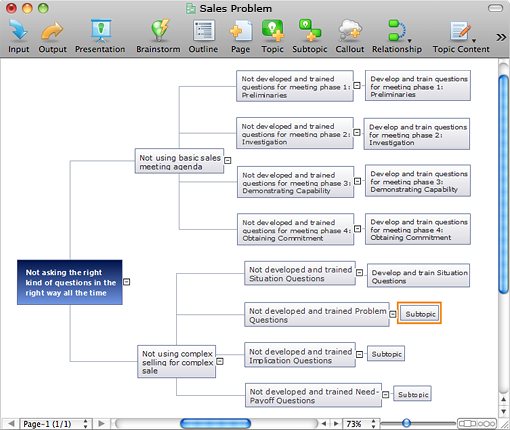
- Apply appropriate topic types to topics of factors, causes and corrective actions
- Use Output “Root Cause Diagram” to create a diagram from ConceptDraw MINDMAP
Involvement Matrix
How to Identify What People and Groups Are Involved in Corrective Actions, and What Their Role is in Every Action
The Involvement Matrix is constructed for all highly-prioritized corrective actions. It defines the participants and their roles in identified corrective actions.
The matrix displays all of the parties involved, defines the level of involvement and nature of participation. The diagram shows the degree of involvement for all identified parties in the execution of corrective actions.
We assign who participates, who performs, consults, who should be informed, who checks the work, and who accepts the results. The Involvement Matrix can identify the distribution of responsibilities and identify roles in a group or team. The matrix can be used company wide.
How to Determine Participants and Their Involvement in Corrective Actions by Using ConceptDraw Office 2
- Create new Document using “Action Involvement Matrix” template in ConceptDraw DIAGRAM
- Enter corrective actions and roles
- Specify involved people and groups
PERT Chart
How to Build a Schedule of Actions
The PERT Chart is constructed as a way to create a schedule of corrective actions. The PERT Chart shows the logical sequences of corrective actions on the time scale. This PERT Chart shows the time period for problem solving and the corrective actions along the critical path.
The PERT Chart is also known as a Precedence Diagram or Project Network Diagram. Creating the PERT Chart defines the schedule of work.
How to Schedule Corrective Actions by Using ConceptDraw Office 2
- Open a new schedule document in ConceptDraw PROJECT
- Enter all corrective actions, set start and finish dates, connect the actions by logical links
- Go to File ? Sharing. Select “PERT Chart”
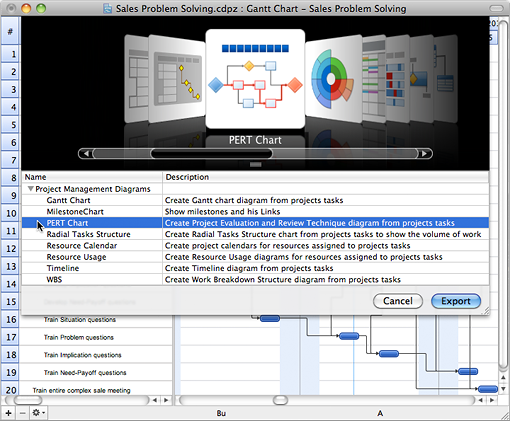
- Use “PERT Chart” output to generate a PERT chart in ConceptDraw DIAGRAM
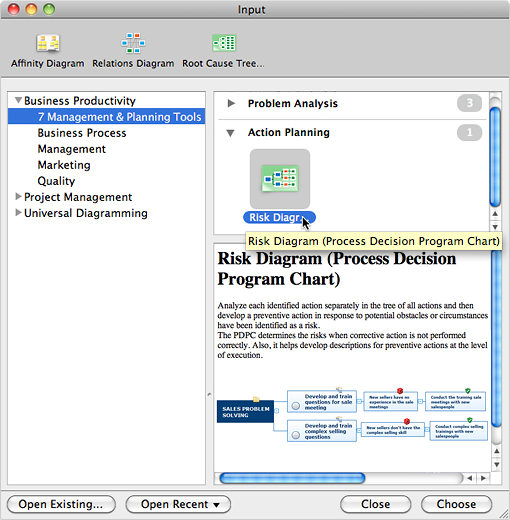
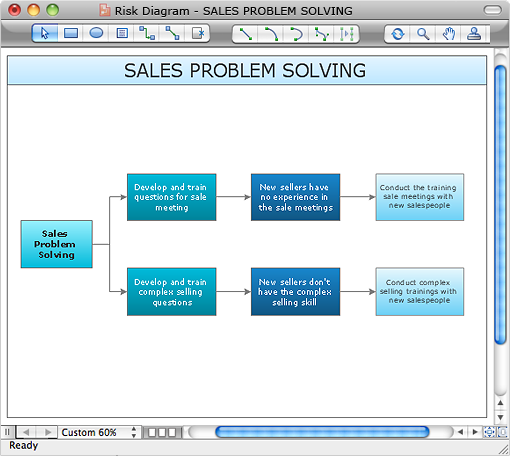
Risk Diagram (PDPC)
How to Identify Possible Risks When Carrying Out Corrective Actions, and Define Preventive Actions
The Risk Diagram determines the risks of potential obstacles during corrective actions, and helps develop preventive actions.
How to Identify Possible Risks and Develop Preventive Actions by Using ConceptDraw Office 2
- Use “Risk Diagram” input template in ConceptDraw MINDMAP
- Copy all corrective actions from ConceptDraw PROJECT schedule document, and paste into the mind map as actions tree
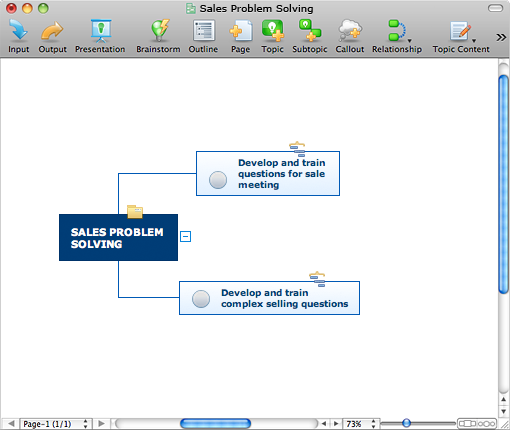
- Add subtopics of risks to terminal topics of corrective actions
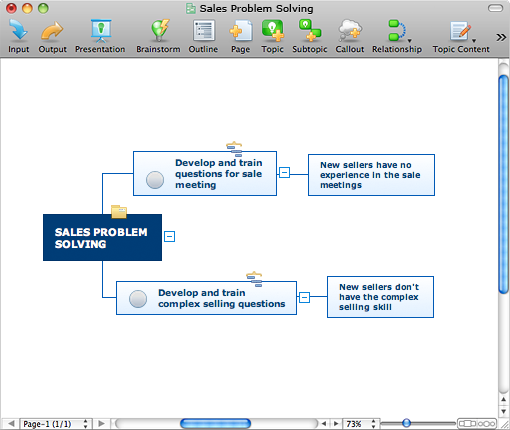
- Add subtopics of preventive actions to topics of risks
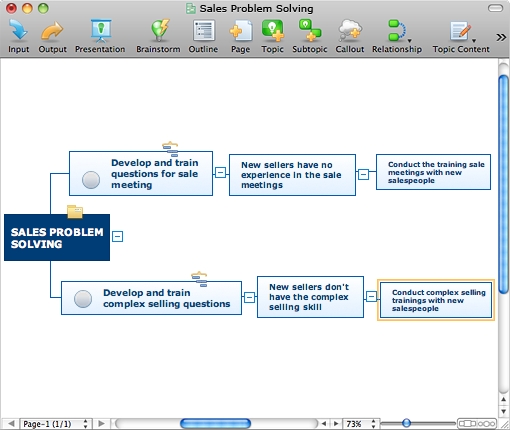
- Use built-in template topic types “Risk” and “Preventive Action”

- Create Risk Diagram in ConceptDraw DIAGRAM by selecting the “Risk Diagram” output in ConceptDraw MINDMAP
About
Benefits: The “7 Management and Planning Tools” solution implements
Objective: Provide comprehensive tools for problem analysis.
Solution Purpose: Assists in the solving of common business problems by using a
Intended For: This comprehensive solution set is intended for managers in any size company, who are looking for tools to address issue management. The 7 MP solution is intended for business consultants, trainers and coaches to assist in visualization of different problem solving methodologies.
Products and Methods: ConceptDraw MINDMAP is used for structuring and analyzing information. ConceptDraw PRO is used to generate

Solution Reference
Use 7 MP Tools for
Problem analysis: structure problem affecting factors, analyze their cause and effect relations, highlight factor drivers and indicators, prioritize factors using ranking by criteria set, analyze factor root causes and develop corrective actions.
Action planning: define people and groups involvement in corrective actions by roles, identify logical sequences of scheduled actions and critical path of problem solving, identify possible risks of action plan and propose preventive actions.
Use visual communication during all steps of issue management to improve understanding and gain team involvement.
Toolbox 1. Identify and Structure Factors
Use the Affinity diagram to collect and structure factors that impact on a problem.
| Tasks | Actions | Products |
| Start new document using appropriate template | In ConceptDraw MINDMAP use ”Affinity diagram“ input | MM |
| Collect all factors affecting a problem | Use brainstorming mode to identify factors, collect all input and place in a mind map | MM |
| Create factor tree | Organize factors using ConceptDraw tree structure | MM |
| Create Affinity diagram | Use output “Affinity diagram” to create diagram | MM, PRO |
Toolbox 2. Analyze Factors Relations
Use the Relations diagram to create a relations factors map and to identify which factors are “drivers” and “indicators”.
| Tasks | Actions | Products |
| Start new document using appropriate template | In ConceptDraw MINDMAP use “Relations diagram” input | MM |
| Collect all factors affecting a problem | Start brainstorm mode, add identified factors to map, collect all input and place in a mind map | MM |
| Denote factors relations | Use the ConceptDraw relations functionality to show relations between factors | MM |
| Create Relations diagram | Use output “Relations diagram” to create a diagram, use diagram to identify “drivers” and “indicators” | MM, PRO |
Toolbox 3. Create Prioritization matrix
Use the Prioritization matrix to define factor priority.
| Tasks | Actions | Products |
| Start new document using appropriate template | In ConceptDraw PRO open Prioritization matrix template | PRO |
| Rank factors | Enter factors and criteria in table, rank factors | PRO |
Toolbox 4. Root cause analysis (RCA) tree diagram
Use the Root cause analysis (RCA) tree diagram to perform visual root cause analysis.
| Tasks | Actions | Products |
| Start new document using appropriate template | In ConceptDraw MINDMAP use the “Root cause analysis tree diagram” input | MM |
| Create root cause analysis tree | Use mind map structure for organization/ use topic types: factor, cause, corrective action | MM |
| Create Root cause analysis (RCA) tree diagram | Use output “Root cause analysis tree diagram” to create diagram | MM, PRO |
Toolbox 5. Involvement matrix
Use the Involvement matrix to specify roles and responsibilities of actions in problem solving.
| Tasks | Actions | Products |
| Start new document using appropriate template | In ConceptDraw PRO open “Action involvement matrix” template | PRO |
| List corrective actions and roles, then specify involved people and groups | Enter corrective actions and roles, identify and enter involved people and groups | PRO |
Toolbox 6. PERT chart
Create the PERT chart to work with action order, and rework actions to reduce critical path length.
| Tasks | Actions | Products |
| Start new schedule document | In ConceptDraw PROJECT create new schedule document | PRJ |
| Enter actions in the schedule | Enter actions in the schedule, set start and finish dates, and logical links between actions | PRJ |
| Create PERT chart | Use plugin “PERT chart” to generate PERT chart in ConceptDraw PRO | PRJ, PRO |
Toolbox 7. Risk diagram (PDPC)
Analyze problem solving risks and propose preventive actions.
| Tasks | Actions | Products |
| Start new document using appropriate template | In ConceptDraw MINDMAP use |
MM |
| Create problem solving action plan tree, add risks and preventive actions | From ConceptDraw PROJECT action plan schedule copy all actions into mindmap to create action plan tree, then add topics of risks and preventive actions; use topic types “Risk” and “Preventive action” | MM |
| Create Risk diagram | Use output “Risk diagram” to generate Risk diagram in ConceptDraw DIAGRAM | MM, PRO |
Solution Functional Overview
Concept
The solution Seven Management and Planning Tools assists in problem analysis and development of a solution path by using a set of problem solving methodologies. The Seven Tools solution provides a complete cycle to address problems; from analysis and search for root causes, to leveling factors in risk assessment.
Overview
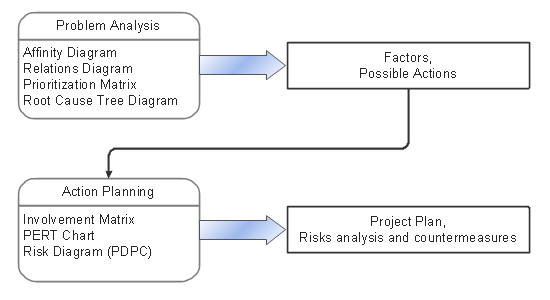
The solution implements the methodology of Seven Management and Planning Tools. The scenario of problem solving process consist of two stages:
- Problem Analysis
- Corrective Action Planning
The methodology stages included in this solution are: Affinity diagram, Relations diagram, Root cause analysis tree diagram, Prioritization matrix, Involvement matrix, PERT chart and Risk diagram (PDPC).
The software tools of the solution:
- ConceptDraw MINDMAP — idea structuring, mind mapping and brainstorming software for team work.
- ConceptDraw PROJECT — project planning and management software.
- ConceptDraw DIAGRAM — software for visual representation of process results in the form of diagrams, schemes, illustrations and presentations.
PRO BLEM ANALYSIS
AFFINITY DIAGRAM, Gather and structure factors
| Tasks | Actions | Products |
| Affinity diagram input | Affinity diagram input template | MM |
| Affinity diagram output | Output |
MM |
| Affinity diagram, library of graphic objects | Collection of graphic objects, used for creating Affinity diagram manually, and also by using a |
PRO |
| Affinity diagram template | ConceptDraw PRO template for drawing Affinity diagram | PRO |
| Business expansion | Affinity diagram sample | PRO |
| Implementing continuous process improvement | Affinity diagram sample | PRO |
| Personal activity | Affinity diagram sample | PRO |
RELATIONS DIAGRAM, factors analysis, factors relations
| Tasks | Actions | Products |
| Relations diagram input |
Relations diagram input template | MM |
| Relations diagram output |
Output |
MM |
| Relations diagram, library of graphic objects | Collection of graphic objects, used for creating Relations diagram manually, and also by using a |
PRO |
| Relations diagram template | ConceptDraw PRO template for drawing Relations diagram | PRO |
| Health Care | Relations diagram sample | PRO |
| Sales process | Relations diagram sample | PRO |
PRIORITIZATION MATRIX
| Tasks | Actions | Products |
| Prioritization matrix template | ConceptDraw DIAGRAM template for creating Prioritization matrices | PRO |
| Prioritization matrix.cdl, library of graphic objects | Collection of graphic objects, used for creating Prioritization matrices | PRO |
| Sales activity | Prioritization matrix sample | PRO |
| Opportunity prioritization matrix | Prioritization matrix sample | PRO |
ROOT CAUSE ANALYSIS TREE DIAGRAM
| Tasks | Actions | Products |
| Root cause analysis tree input |
Root cause analysis tree diagram input template | MM |
| Root cause topic types | Topic types used for Root cause analysis tree diagram — “problem, cause, solution” | MM |
| Root cause analysis tree diagram output |
Output |
MM |
| Root cause analysis tree diagram , library of graphic objects | Collection of graphic objects, used for creating Root cause analysis tree diagram manually, and also by using a |
PRO |
| Root cause analysis tree diagram template | ConceptDraw DIAGRAM template for creating Root cause analysis tree diagram | PRO |
| Manufacturing problem solution | Root cause analysis tree diagram sample | PRO |
| Personal problem solution | Root cause analysis tree diagram sample | PRO |
| Sale problem solution | Root cause analysis tree diagram sample | PRO |
CORRECTIVE ACTIONS PLANNING
INVOLVEMENT MATRIX Define participants involvement
| Tasks | Actions | Products |
| Involvement matrix template | ConceptDraw PRO template for creating Involvement matrix | PRO |
| Involvement matrix-2 template | ConceptDraw DIAGRAM template for creating Involvement matrix 2 | PRO |
| Involvement matrix, library of graphic objects | Collection of graphic, used for creating involvement matrix | PRO |
| Distribution of responsibilities | Involvement matrix sample | PRO |
| Project participants involvement | Involvement matrix sample | PRO |
| Sale problem solution | Involvement matrix sample | PRO |
| SEPP program roles and responsibilities | Involvement matrix sample | PRO |
| Central statistical office | Involvement matrix sample | PRO |
PERT CHART. SCHEDULE CORRECTIVE ACTIONS
| Tasks | Actions | Products |
| PERT output |
ConceptDraw PROJECT 6 output |
PRJ |
| PERT, library of graphic objects | Collection of graphic objects, used for creating a PERT chart manually, and also by using a |
PRO |
| PERT template | ConceptDraw PRO template for creating PERT charts | PRO |
| Project Management | PERT chart sample | PRO |
| Request for proposal (RFP) | PERT chart sample | PRO |
| Sale problem solution | PERT chart sample | PRO |
RISK DIAGRAM. PROJECT RISK ASSESSMENT
| Tasks | Actions | Products |
| Risk diagram (PDPC) input |
Process decision program chart input template | MM |
| Risk diagram topic types | Topic types used in Risk diagram — “risk, countermeasure” | MM |
| Risk diagram output |
Output |
MM |
| Risk diagram (PDPC) template | ConceptDraw PRO template for creating PDPC diagrams | PRO |
| Risk diagram (PDPC), library of graphic objects | Collection of graphic objects in single package. Used for PDPC chart manually, and also by using a |
PRO |
| Minimization of Material Wastage | Risk diagram sample | PRO |
| Personal Activity | Risk diagram sample | PRO |
| Health Care | Risk diagram sample | PRO |
Manage Problem Solving Using “Seven Management and Planning Tools”
In management practice, we regularly face problems which have no clear answers, and the causes of these problems need to be intensely researched before we can make any final decisions. These are complex and stressful situations for managers. In ConceptDraw Solution Park we have collected seven
When we were researching these tools for an addition to ConceptDraw Solution Park, we found that they were often used at different stages of the same process for complex problems. As we applied these tools to different stages of the overall process of solving management problems, we started developing a great set of visual software tools for ConceptDraw which can increase productivity at every stage of
Finally, we organized these tools to maximize their
What Makes a Problem Complex and How Do the 7 Tools Help?
A complex problem is one that includes many unclear factors, such as unknown impacts, unidentified limitations, changing circumstances, and many potential outcomes. Such problems often occur in quality improvement, innovative opportunity development, and the
Because of the
The Seven Management and Planning Tools are a set of such tools for investigating complex problems. These tools are exemplary at organizing research, parsing complex problems, providing a structure for the details, helping managers make decisions, and organizing effective communications in a visual manner that keeps everyone involved.
Why is the 7 Tools Approach Beneficial?
The primary benefit of using the Seven Management and Planning Tools is saving time in teamwork collaboration while simultaneously producing presentation material for an action plan, building a clear message, and producing comprehensive reporting.
- The Action Plan. At the end of your process after applying the Seven Management and Planning Tools, we obtain a
well-thought out and positioned management plan - The Clear Message. Problem and solution are properly packaged so that they can be broadcast to all participants who are assigned to a problem. It is in solving quality issues, creating
ground-breaking innovations, organizing a production process, or major company changes where it is necessary to provide a clear andwell-structured message to all parties. This saves time because creating a message happens almost automatically as a result of thedecision-making process - The Report. Everyone who is involved in the process of solving the problem needs to see a visual record of the steps that were developed to address the problem of quality, the elimination of defects, or the process of change management
Organizing Teamwork
To explore a complex problem, it is necessary to identify possible solutions and then develop a plan of action. Diagrams that visually explain the stages of researching the problem can help find the structure of the problem, and then determine what tasks need to be solved. In general, managers need to accurately determine the actions, identify the priorities, and then execute the plan with minimal interruptions.
Teamwork — as it relates to communication on large and complex problems—is the most effective when each participant clearly understands which stage of solving a problem is going on currently.
How Does It Work?
In practice, the management team makes a decision on a problem in two stages. The first stage is problem analysis and the second stage is action planning. During the analysis of a problem, one develops a large list of first causes and possible actions. From planning comes an action plan, a list of risks and potential countermeasures.
During these two stages occurs the problem of parsing and recording details in the form of visual diagrams. Possible actions and a new action plan are then created using related diagrams. These diagrams describe the detailed decisions the team makes as they work toward resolution.
Using visual diagrams keeps ideas clear and is very effective when discussing the problem and a description of the solution. Visual diagrams can replace a tremendous amount of text, and often the message is easier to understand. They are great at helping to quickly see what stage of the
We start with brainstorming for proper analysis of any problem. This form of data input gives us a picture of the scale of the problem. We list all of the factors affecting the problem. Usually there are 40 to 100 topics that come to mind in discussions on quality improvement, events, changes, or
Visually, Step by Step
Stage by stage, we use visual tools to move toward solving the problem at hand:
- Affinity diagram. This is a grouping and structuring of factors that impact on a problem.
Here we structure factors by groups. Then, give each group a name.
Affinity diagrams show the structure of large, complex factors that impact the problem, dividing them into smaller and simpler pieces. Affinity diagrams do not show a causal relationship between the factors. This chart is designed to prepare the data for further analysis of
cause-effect relationships. The typical size of an affinity diagram is40-50 topics in a chart. - Interaction diagram*. This diagram identifies causal relationships.
Determine what factors are causes and which factors are effects. Factors that are causes are called “Drivers”, the results of factors called “Indicators”. Indicators help establish KPIs to monitor changes and the effectiveness of corrective actions in resolving the problem.
* This diagram is also known as a Relations diagram and the identification process known as a
Cause-and-Effect Analysis. - Prioritization matrix. This diagram ranks the drivers’ factors to determine priority.
The Prioritization matrix ranks the driver factors using a set of criteria. It identifies the factors of the first priority for analysis of possible corrective actions. It assesses the weight of each factor for each criterion and specifies it in the Prioritization matrix. The total sum of weights for a factor’s criteria indicates its priority.
- Root cause analysis tree diagram. This diagram is for Root cause analysis (RCA).
Analyze the root causes for factors that influenced the problem.
This diagram is constructed separately for each highly prioritized factor. The goal of this is to find the root causes for the factor and list possible corrective action. The diagram shows the structure of causes for factor and possible corrective action. The Diagram is then used for further formulation of potential actions.
- Involvement matrix. This diagram identifies participants who are involved in corrective actions.
The Involvement matrix is constructed for all highly prioritized corrective actions. It defines the participants and their roles.
The matrix displays all of the parties involved, defines their level of involvement, and the nature of their participation.
This diagram uses symbols to assign who participates, performs, consults, should be informed, checks the work, and accepts the results. The Involvement matrix can identify the distribution of responsibilities and identify roles in a group or team. This matrix can be used company wide.
- PERT chart*. This diagram identifies and builds the schedule of actions.
This diagram is constructed as part of the process in creating a schedule of corrective actions. The PERT chart shows the logical connections and consequence of tasks to be performed. It displays the time period for problem solving and the implementation of all activities through the critical path.
* This diagram is also known as a Precedence diagram or a Project network diagram.
- Risks diagram*. This diagram identifies possible risks in accomplishing corrective actions.
With the Risks diagram, one analyzes each action separately in a tree of all actions and develops a preventive action in response of each potential obstacles or circumstances which may be a risk.
This diagram determines the risks that corrective action may have if not performed correctly. Also, it helps work out descriptions for preventive actions at the level of execution.
* This diagram is also known as a Process decisions program chart (PDPC).
Benefits and Applicability of the 7 Tools
As you can see, the 7 Tools set can be of tremendous help to management. The 7 Tools simplify the different steps of
As powerful as these tools are, many times you will find that one tool is enough—that you will only need to create that one diagram to help structure a particularly difficult aspect of your problem. This enables you to make your
Skilled use of these diagrams makes collaborative teamwork both more engaging and more effective. The decisions that are made during these discussions and
The 7 Tools are also excellent for making presentations on status updates and final results of your
Recommendations for Using the 7 Tools
Do I have to use all of the tools in order?
No, not necessarily. These tools are quite versatile. Since you can use them in a different order, the options for applying these tools are much more numerous. In practice, groups of factors may not require all 7 stages. So the team can use a separate chart, depending on the desired stage of solving the complex problem.
Is it necessary to do a quantitative assessment?
It is highly recommended. Making quantitative assessments in the diagrams makes the work on the diagrams quite specific. This is not mandatory, but provides a much clearer picture of the team’s tasks specifics.
If there are fewer than 40 factors, should I still use these tools?
The 7 Tools permit you to explore the complexity of the problem, to create a detailed view, and to assess the number of skills that are required. Using a small number of factors develops a detailed understanding of a problem’s complexity and helps build a proven demand for resources (human, material, or otherwise). This lets you explain the involvement of participants who are critical for overall success.
We are a team of managers who want to improve the effectiveness of using visual communication. What do we do?
Advice for improving visual communication:
Always draw your thoughts and ideas while brainstorming. Draw thoughts. Draw processes. Draw ideas and concepts. Use ConceptDraw DIAGRAM or ConceptDraw MINDMAP to help you capture what you think.
How visual communication improves your team’s efficiency:
A
With 7 Tools, the different diagrams are described and arranged in a logical way so that it is easy to see which diagram is appropriate for any given stage of the
Why is it important to draw ideas and solutions?
Teamwork requires a high level of organization. Each team member needs a clear view on how the
Also, at each stage, new ideas and details are often revealed, and these need to be documented. These new details can have a large impact on your results and should be taken into consideration. Therefore, it is important to allow all team members to see a big picture view of the entire