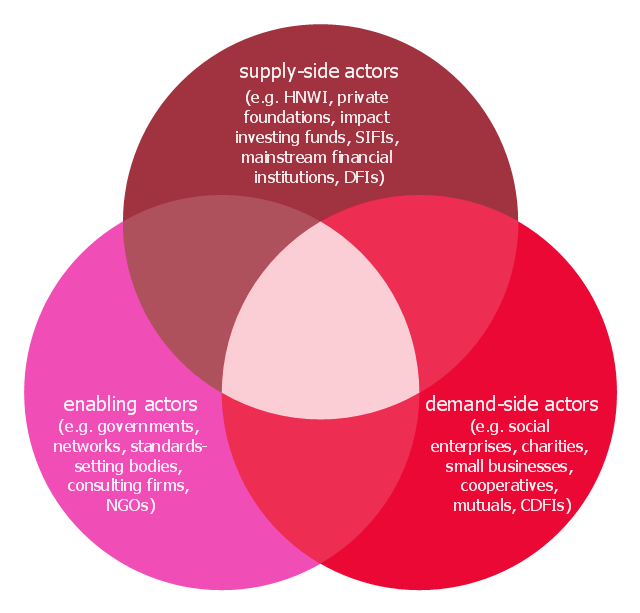
This Venn diagram sample shows the interaction between supply-side, demand-side and enabling actors. It was designed on the base of the Venn diagram in the policy paper "Social Impact Investment Forum: outputs and actions" from the UK Government website.
"Collaboration and market champions.
Social impact investment brings together a diverse group of actors with different goals, expectations and ways of working. A key message from the Forum was that, while roles may overlap, actors must play to their strengths to encourage market growth.
For supply-side actors, this meant investing money and resources in social ventures in a way that would meets investors’ capital and risk profile and would be appropriate to the development stage of the social venture. For demand-side actors, it meant finding new models to deliver impact and new markets for social ventures. Finally, for enabling actors it meant taking action to help build the market ecosystem." [gov.uk/ government/ publications/ social-impact-investment-forum-outputs-and-actions/ social-impact-investment-forum-outputs-and-actions]
Contains public sector information licensed under the Open Government Licence v3.0. [nationalarchives.gov.uk/ doc/ open-government-licence/ version/ 3/ ]
The diagram example "Interaction between market actors" was created using the ConceptDraw PRO diagramming and vector drawing software extended with the Venn Diagrams solution from the area "What is a Diagram" of ConceptDraw Solution Park.
Venn diagram
 Venn Diagrams
Venn Diagrams are actively used to illustrate simple set relationships in set theory and probability theory, logic and statistics, mathematics and computer science, linguistics, sociology, and marketing. Venn Diagrams are also often used to visually summarize the status and future viability of a project.
"Algorithmic trading, also called automated trading, black-box trading, or algo trading, is the use of electronic platforms for entering trading orders with an algorithm which executes pre-programmed trading instructions whose variables may include timing, price, or quantity of the order, or in many cases initiating the order by a "robot", without human intervention. Algorithmic trading is widely used by investment banks, pension funds, mutual funds, and other buy-side (investor-driven) institutional traders, to divide large trades into several smaller trades to manage market impact and risk. Sell side traders, such as market makers and some hedge funds, provide liquidity to the market, generating and executing orders automatically.
A special class of algorithmic trading is "high-frequency trading" (HFT), which is often most profitable during periods of high market volatility. During the past years, companies such as Algorates have employed HFT strategies, recording high profits even during periods in which the markets have seen steep declines." [Algorithmic trading. Wikipedia]
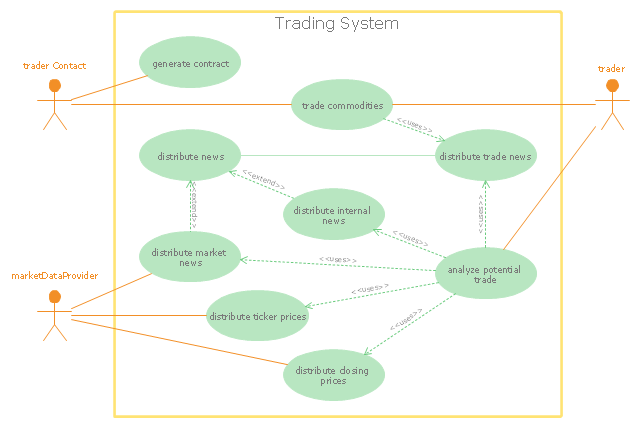
The UML use case diagram example "Trading system usage scenarios" was created using the ConceptDraw PRO diagramming and vector drawing software extended with the Rapid UML solution from the Software Development area of ConceptDraw Solution Park.
A special class of algorithmic trading is "high-frequency trading" (HFT), which is often most profitable during periods of high market volatility. During the past years, companies such as Algorates have employed HFT strategies, recording high profits even during periods in which the markets have seen steep declines." [Algorithmic trading. Wikipedia]
The UML use case diagram example "Trading system usage scenarios" was created using the ConceptDraw PRO diagramming and vector drawing software extended with the Rapid UML solution from the Software Development area of ConceptDraw Solution Park.
UML use case diagram
 Rapid UML
Rapid UML solution extends ConceptDraw PRO software with templates, samples and libraries of vector stencils for quick drawing the UML diagrams using Rapid Draw technology.
- Interaction between market actors
- UML Use Case Diagram Example Social Networking Sites Project ...
- UML use case diagram - Trading system usage scenarios ...
- Main Actors In Bank System
- UML use case diagram - Trading system usage scenarios | Financial ...
- Swim Lane Flowchart Symbols | Cross-Functional Flowchart (Swim ...
- Trading process diagram - Deployment flowchart | Financial Trade ...
- UML use case diagram - Banking system
- UML Tool & UML Diagram Examples | UML use case diagram ...
- Design elements - UML use case diagrams | UML component ...
- UML use case diagram - Trading system usage scenarios | UML use ...
- Trading process diagram - Deployment flowchart | SSADM Diagram ...
- Internet marketing professions | HR professions - Vector stencils ...
- Diagramming Software for Design UML Use Case Diagrams | UML ...
- What Is a Circle Spoke Diagram | Financial Trade UML Use Case ...
- Diagramming Software for Design UML Use Case Diagrams ...
- Use Case Diagrams technology with ConceptDraw PRO | UML Use ...
- Trading process diagram - Deployment flowchart | Financial Trade ...
- UML Use Case Diagram Example - Estate Agency | Work Order ...
- Design elements - UML use case diagrams | Program Structure ...
- ERD | Entity Relationship Diagrams, ERD Software for Mac and Win
- Flowchart | Basic Flowchart Symbols and Meaning
- Flowchart | Flowchart Design - Symbols, Shapes, Stencils and Icons
- Flowchart | Flow Chart Symbols
- Electrical | Electrical Drawing - Wiring and Circuits Schematics
- Flowchart | Common Flowchart Symbols
- Flowchart | Common Flowchart Symbols